1. Reverse Water-Gas Shift
Captured carbon dioxide reacts with hydrogen to form carbon monoxide and water.
www.fuelfromair.com
This website demonstrates our process for converting CO₂ into high-value petroleum products, including diesel, gasoline, and kerosene.
After five years of research and development, Fuel From Air presents a circular-carbon pathway that transforms captured carbon into liquid fuels the world already understands.
Explore the process →We use time-proven chemistry combined with advanced catalysis to convert captured CO₂ and renewable hydrogen into synthesis gas, then into hydrocarbons.
Learn more →Captured carbon dioxide reacts with hydrogen to form carbon monoxide and water.
Synthesis gas is converted over a catalyst to produce long-chain hydrocarbons in the range of diesel, gasoline, and kerosene.
The detailed process route, energy balance, schematics and test data are available to authorised users. Log in, or request the technical physics and chemistry background and the test reports from info@fuelfromair.com.
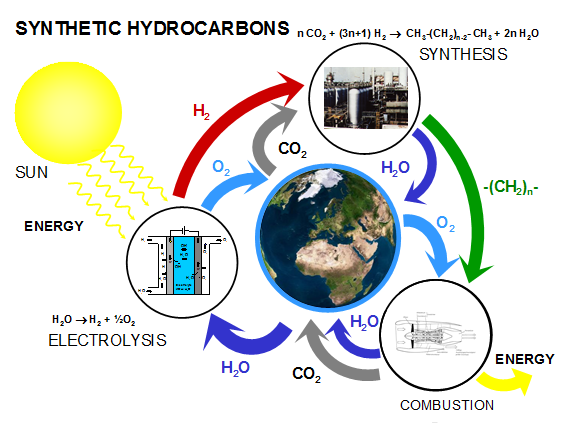
This circular visual shows the relationship between solar energy, electrolysis, CO₂, hydrogen, hydrocarbon synthesis, combustion, and the wider recycled-carbon loop.
The whole process in six steps. Each block shows the reaction and what it does, in the order it happens.
Quantum chemistry sets the energy numbers: the bond energies, heats of reaction and catalyst behaviour behind every step above. The calculators use those measured numbers together with classical engineering (thermodynamics, electricity cost, wind power and plant size).
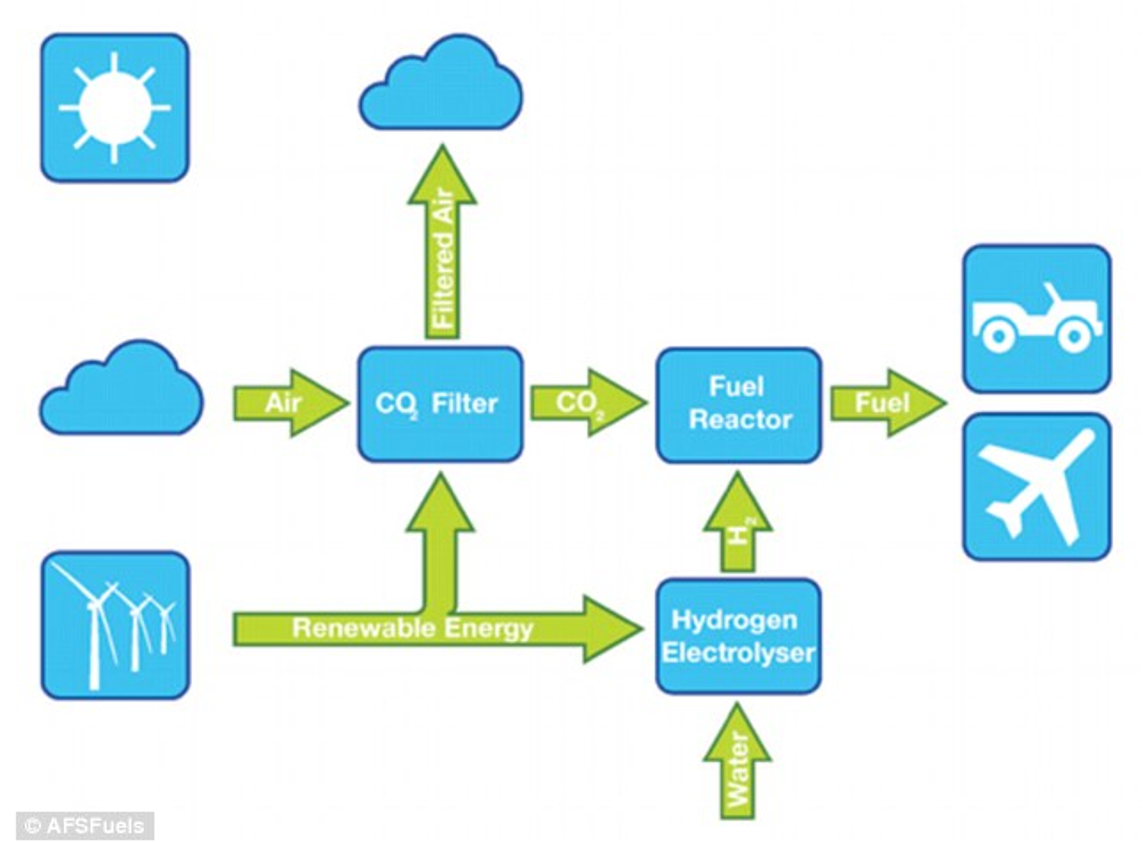
This simplified flow diagram highlights the main process stages: air enters the CO₂ filter, electricity powers the system (renewable energy, or grid power when needed), hydrogen is produced by electrolysis, and the fuel reactor combines CO₂ and hydrogen to create synthetic fuel for transport applications.
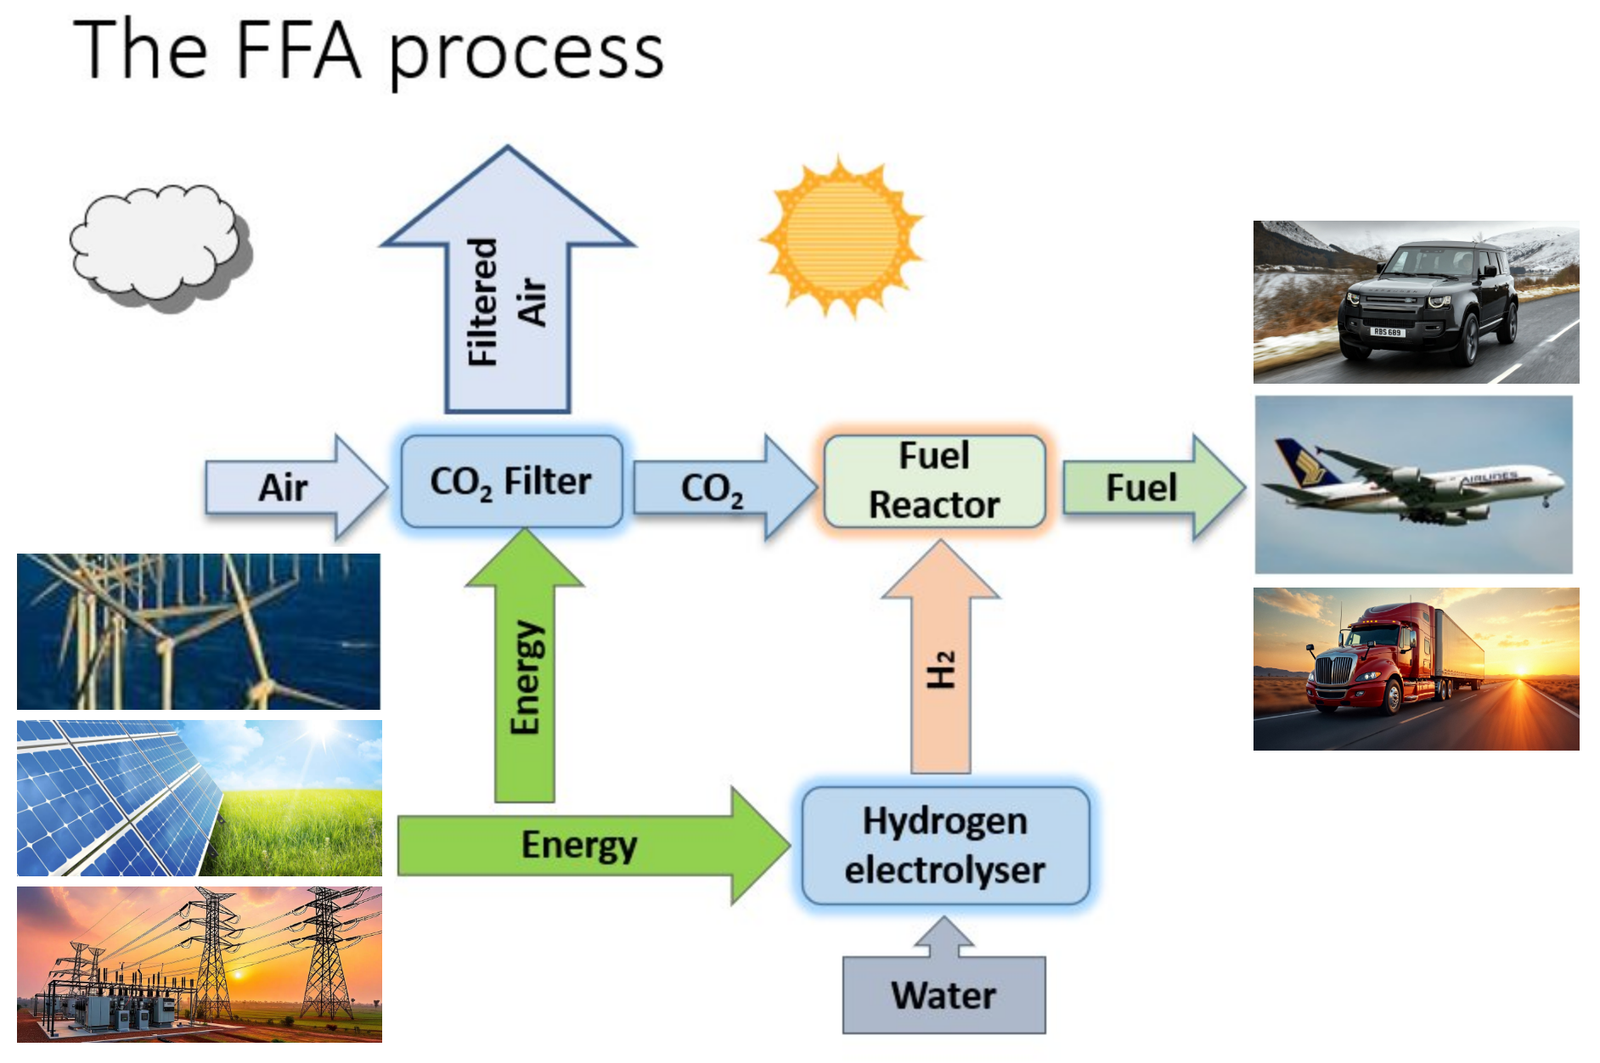
The FFA process in one view: atmospheric air is drawn through a CO₂ filter (powered by electricity, renewable or from the grid), while water is split in a hydrogen electrolyser. The captured CO₂ and hydrogen are combined in the fuel reactor to synthesise a carbon-neutral liquid fuel — up to and including Jet A1 — with clean filtered air returned to the atmosphere.
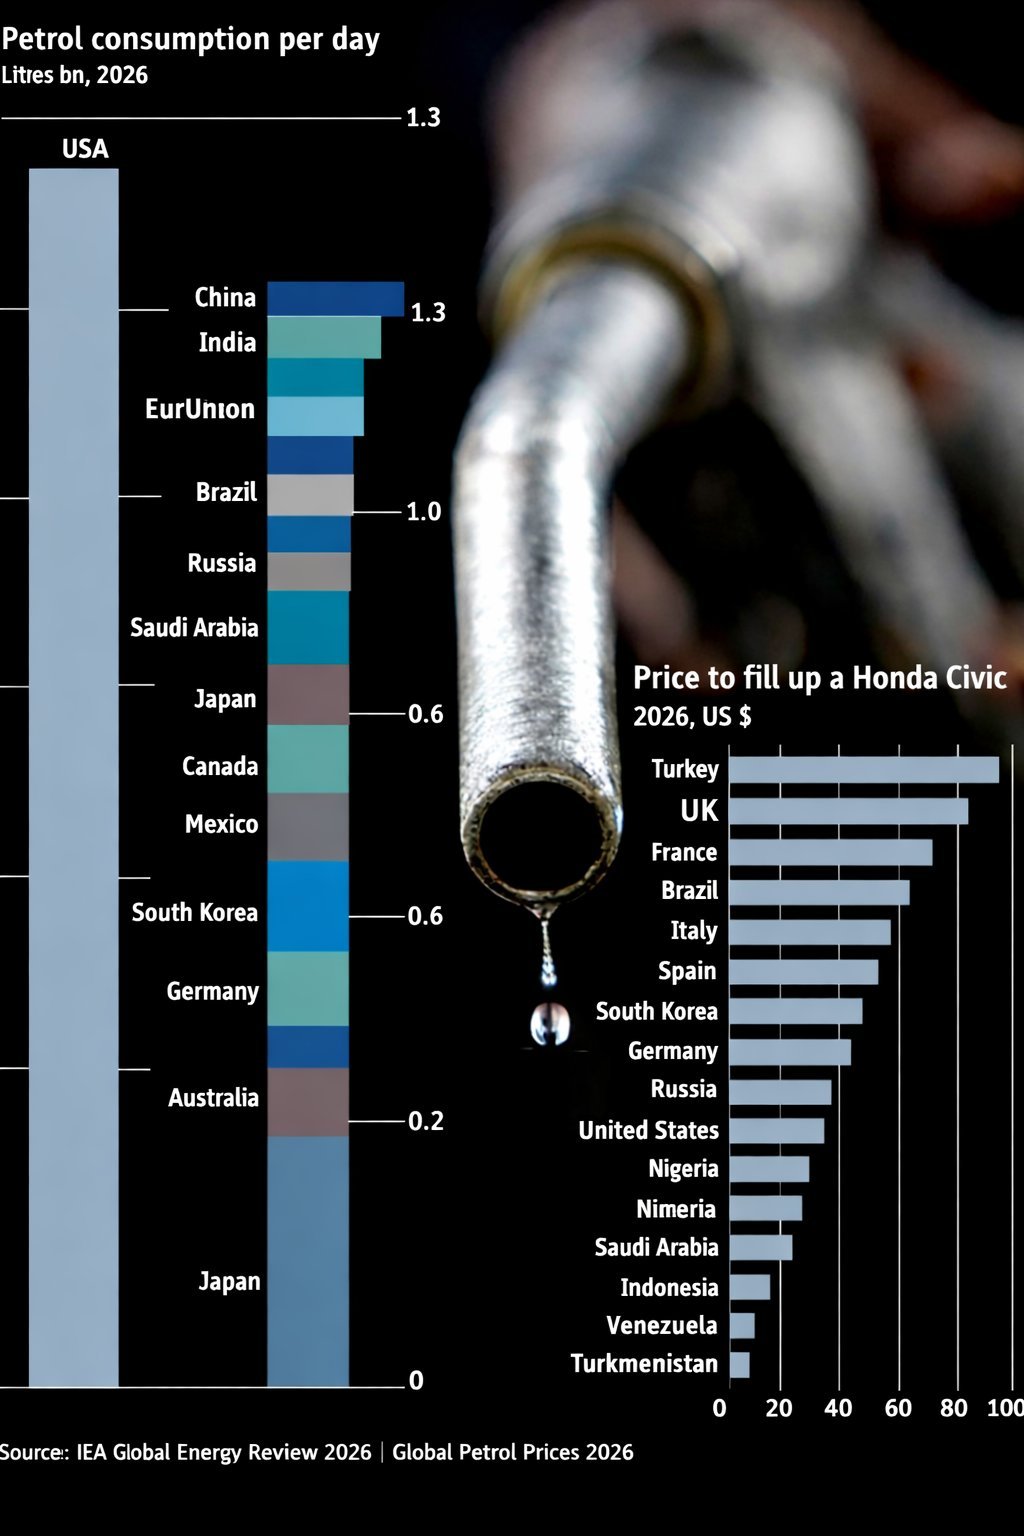
Global petrol demand and the cost of filling up vary enormously by country. The US alone burns over 1.3 billion litres of petrol a day, while the price to fill an average car ranges from under $10 in Turkmenistan and Venezuela to over $90 in Turkey. Synthetic hydrocarbons made from air, water and renewable electricity can displace this fossil demand with a drop-in, carbon-neutral fuel — produced locally, priced against local electricity rather than imported crude.
Sources: IEA Global Energy Review 2026; Global Petrol Prices 2026.
A fully integrated, modular system designed for scale, efficiency, and real-world deployment.
View UK pilot plant →CO₂ captured from industrial sources or the atmosphere.
Electricity (renewable, or from the grid) splits water to produce H₂.
CO₂ and H₂ converted to hydrocarbons over catalysts.
Hydrocarbons refined into diesel, gasoline, kerosene, and more.
Plant gallery
A visual overview of the UK pilot plant, showing the modular installation, control area, process vessels, gas handling equipment, and the engineering hardware used in development and demonstration.
The detailed process route, energy balance, schematics and test data are available to authorised users. Log in, or request the technical physics and chemistry background and the test reports from info@fuelfromair.com.
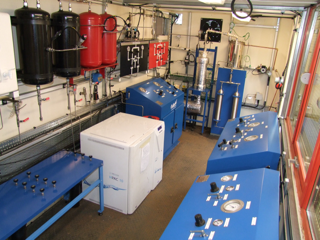
A wide interior view of the UK pilot plant showing the blue control consoles, utility systems, and the integrated process layout inside the modular unit.
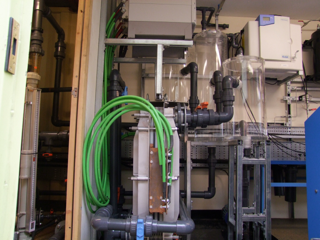
Close-up of the pilot plant treatment section, featuring process vessels, clear chambers, service pipework, and green utility hoses.
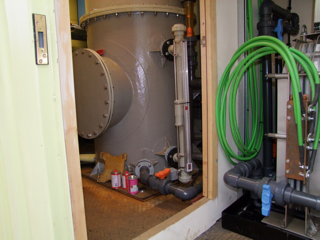
Detail view of a large process vessel and associated piping, valves, and instrumentation within the pilot plant service bay.
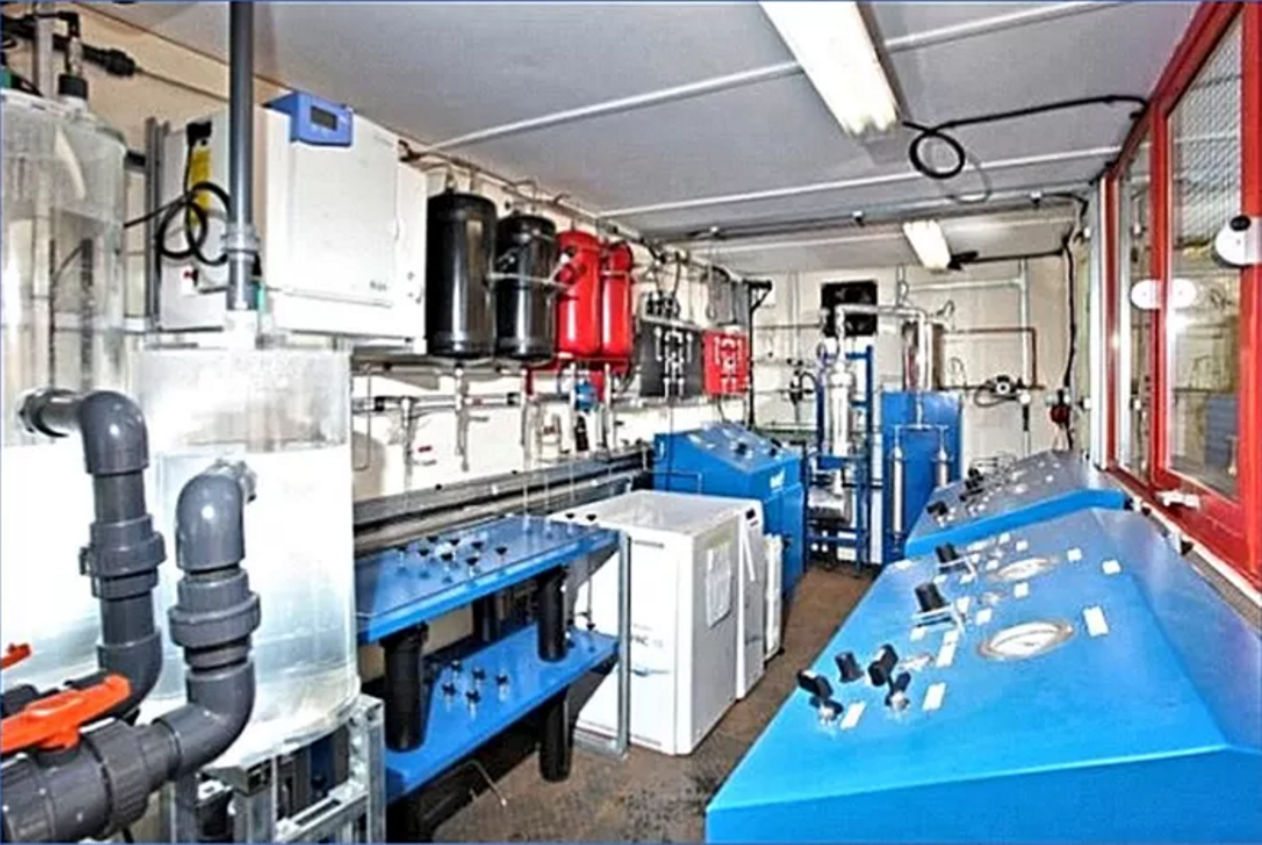
A broader perspective across the modular plant interior, showing the compact arrangement of process equipment and operator access areas.
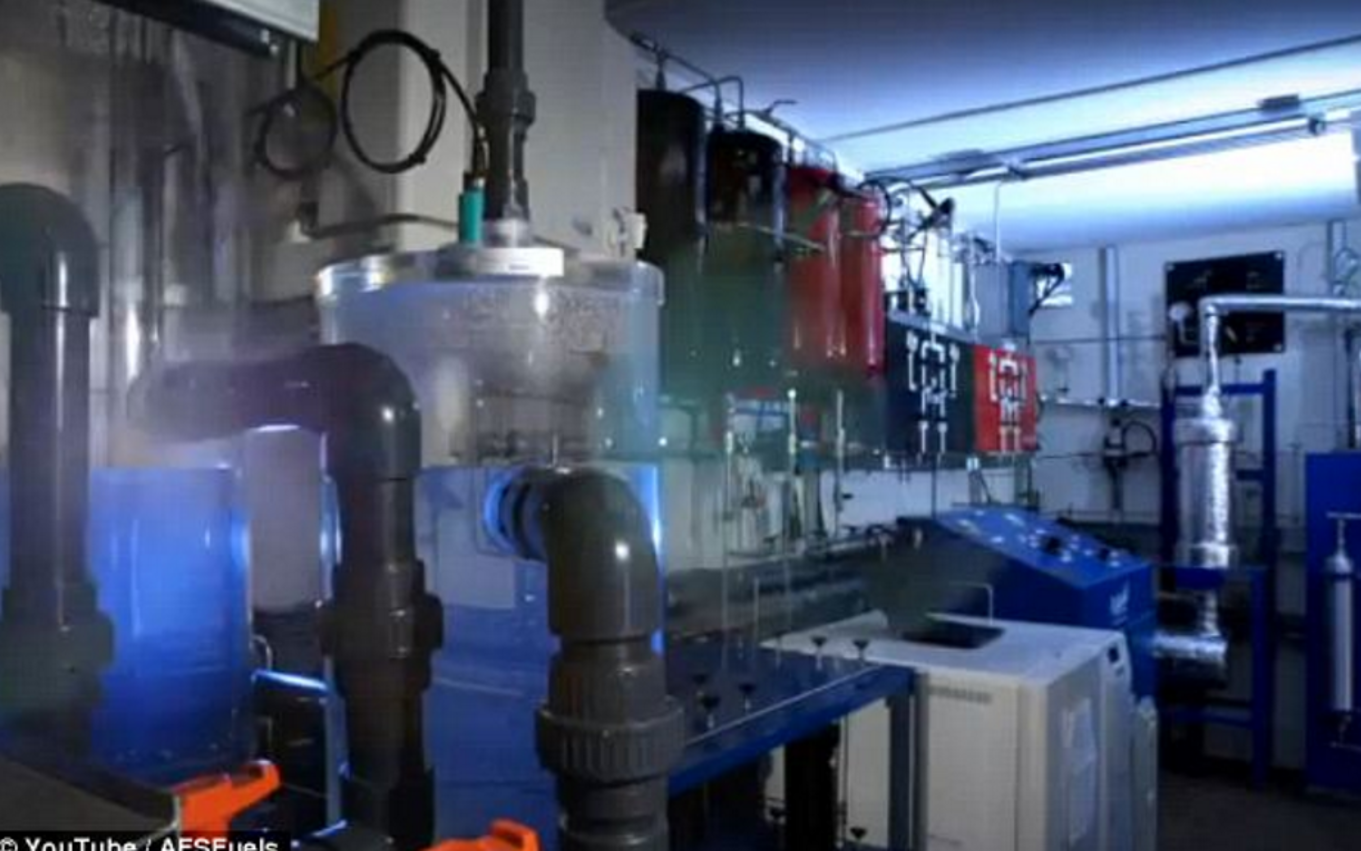
Foreground process chamber with the wider pilot plant visible beyond, illustrating the real-world operational environment of the UK system.
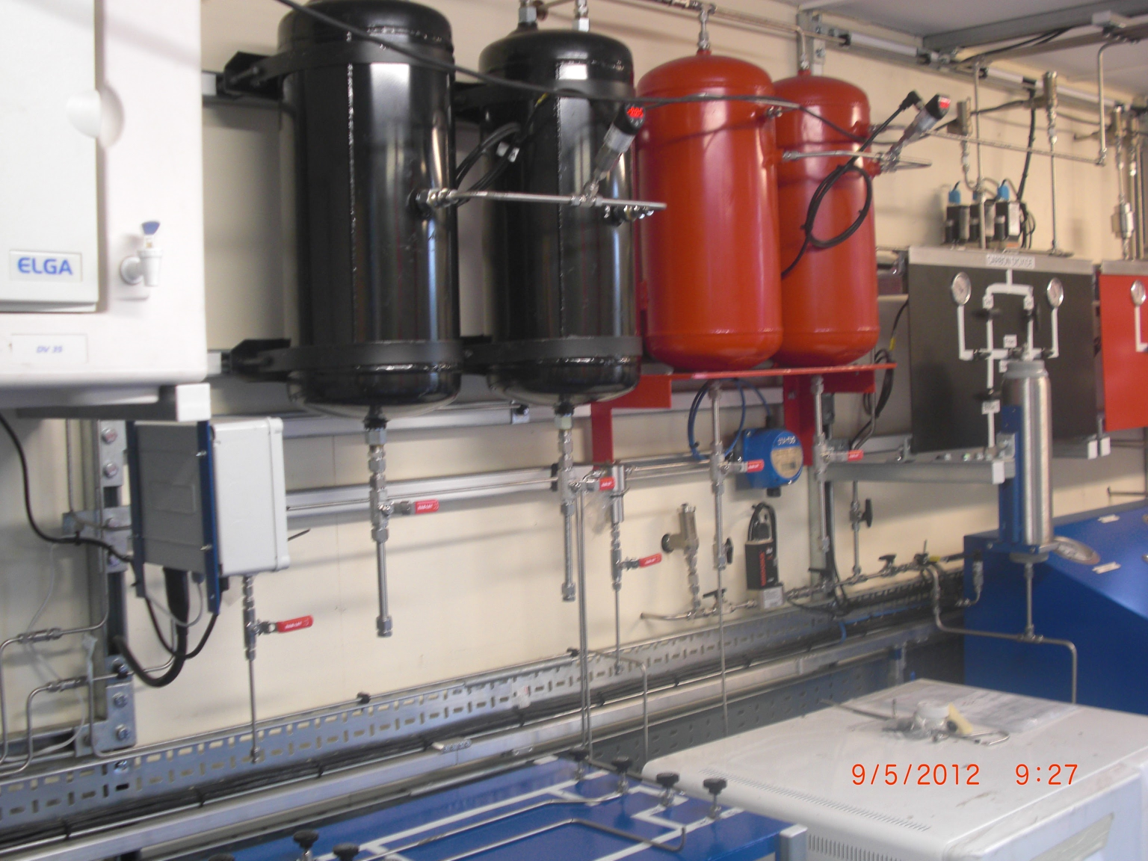
Pressure vessels, stainless pipework, and instrumentation used for gas management, conditioning, and system control.
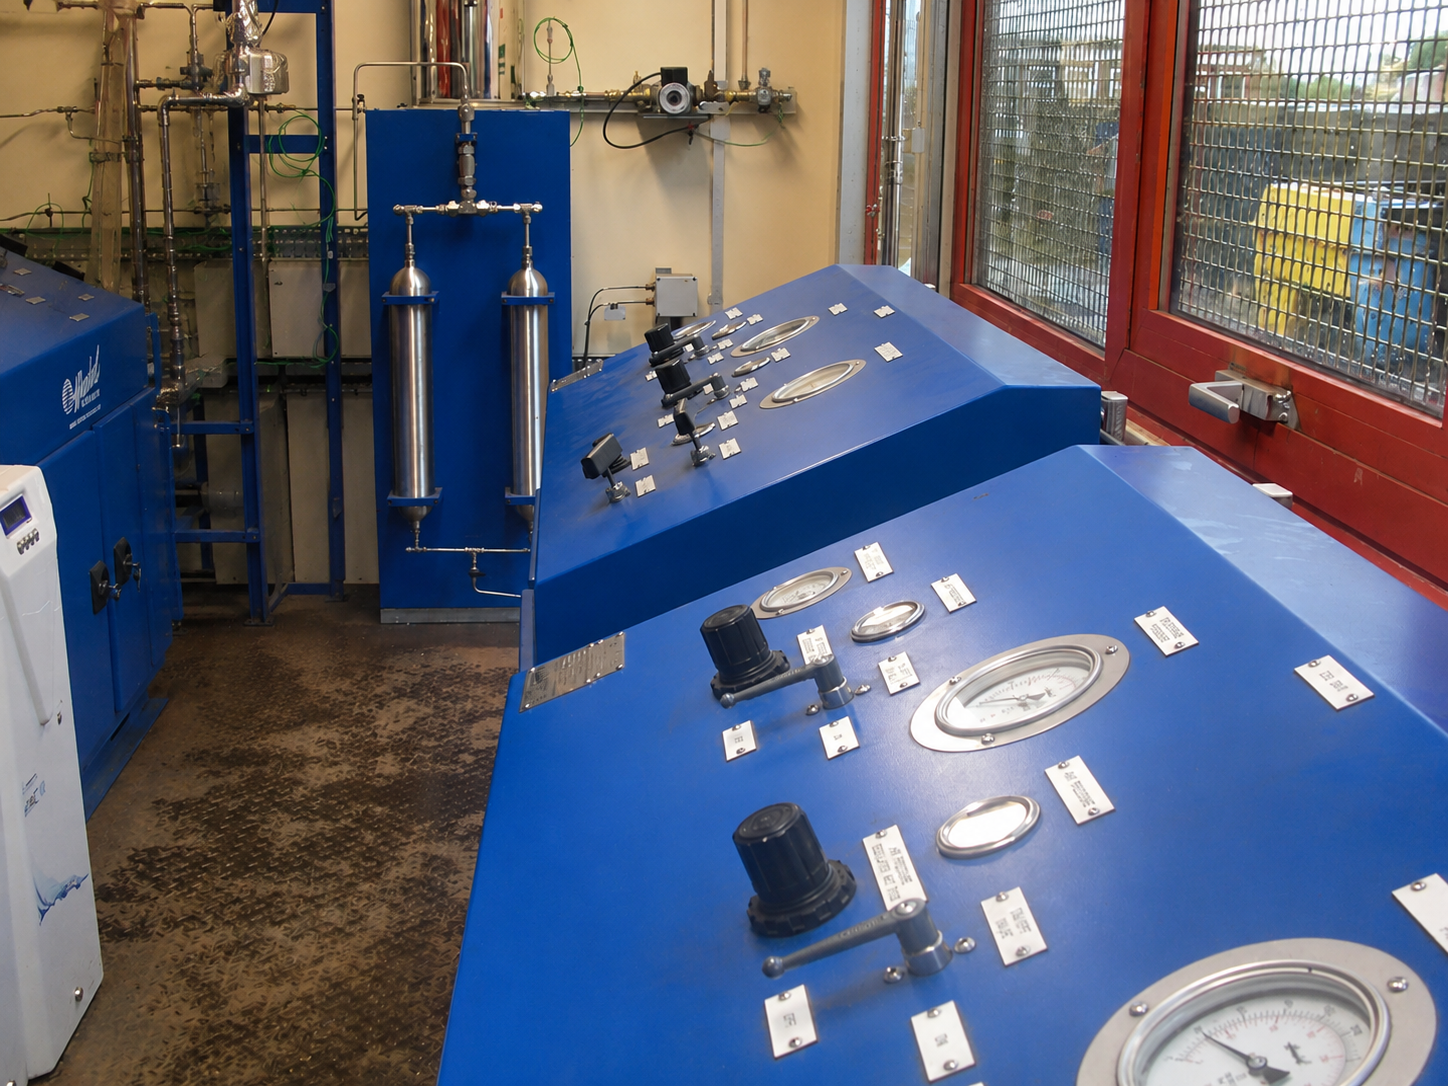
Blue angled control panels with gauges and manual controls used to monitor and operate the pilot plant safely.
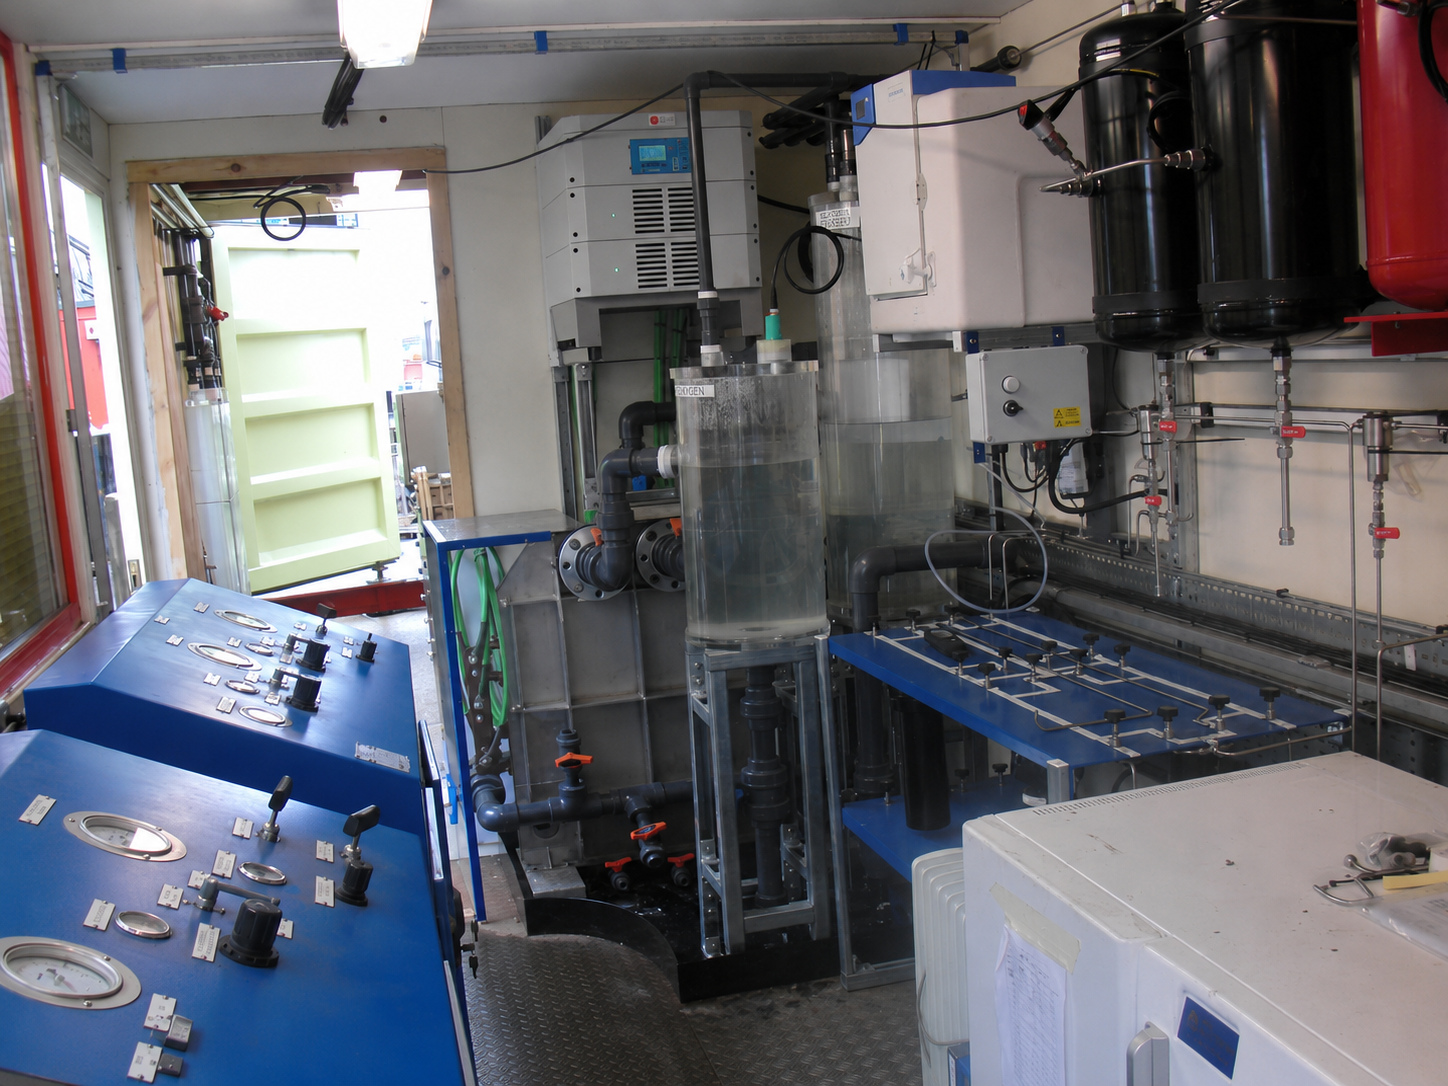
Another interior view showing transparent process vessels, support frames, and the integrated treatment and conversion hardware.
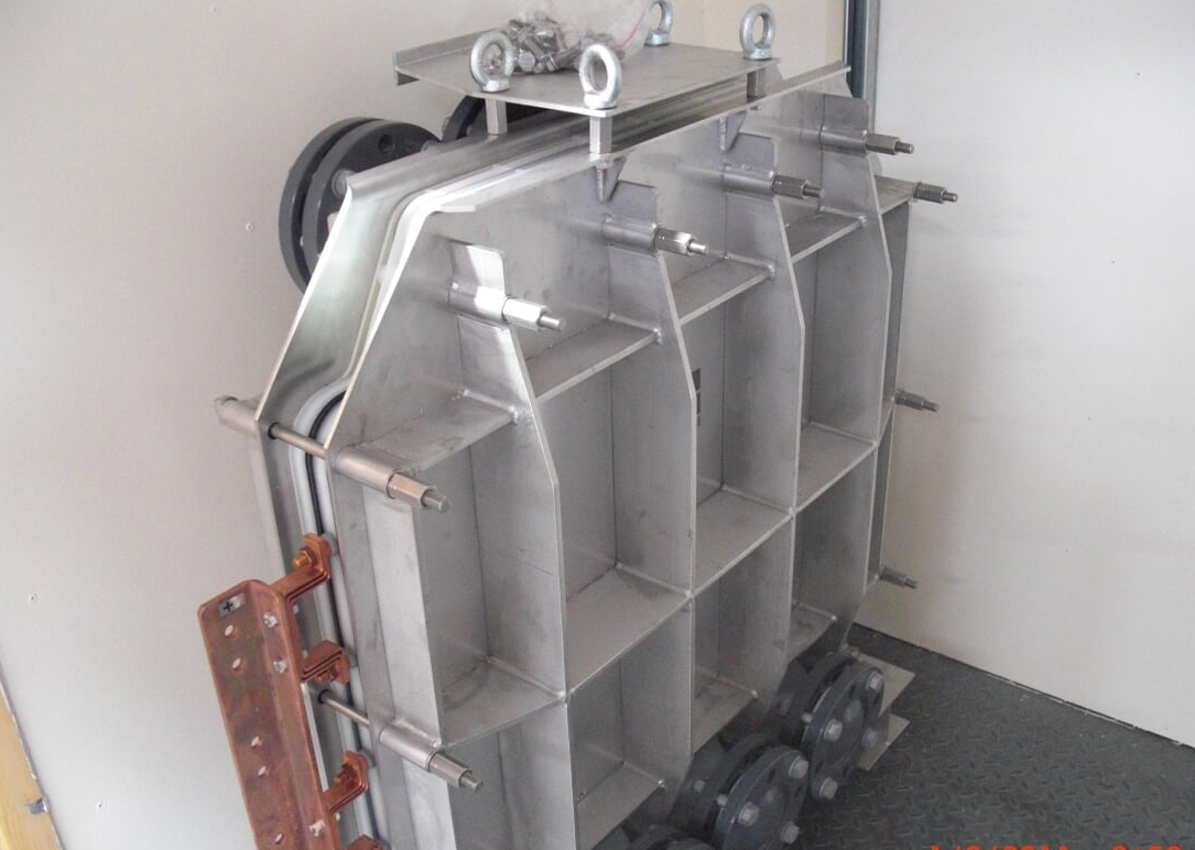
Custom-fabricated metal assembly representing the engineered process hardware developed for pilot-scale operation and testing.
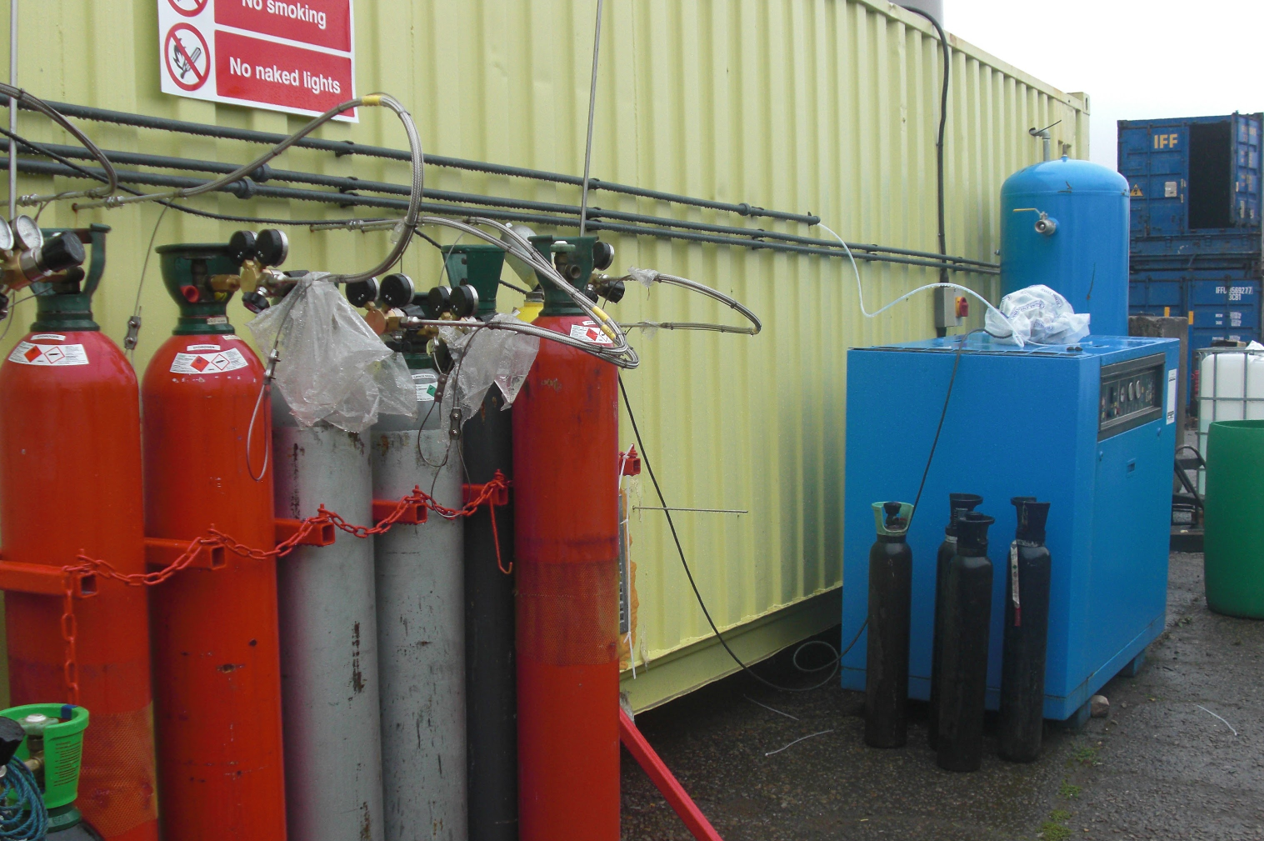
Outdoor support equipment, gas cylinders, and a blue utility module that supply services needed for pilot plant operation.
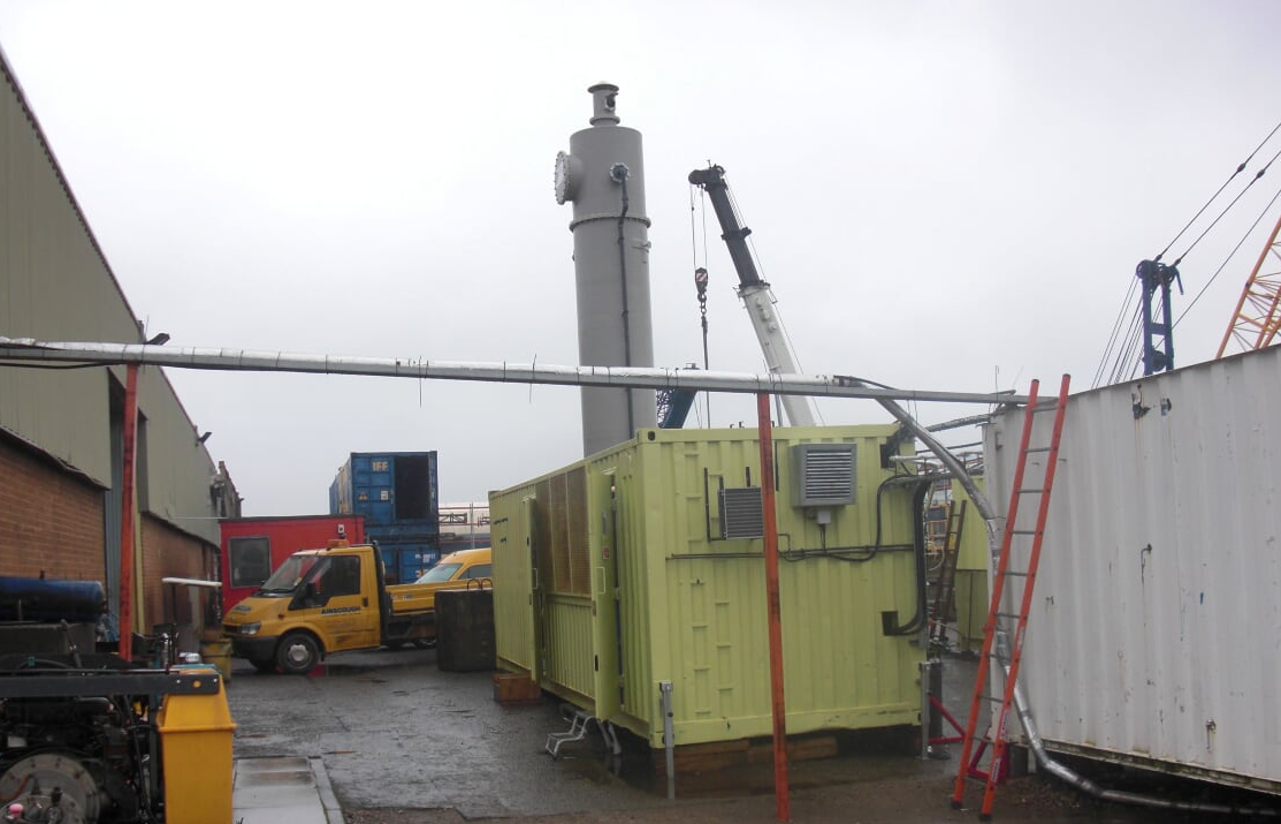
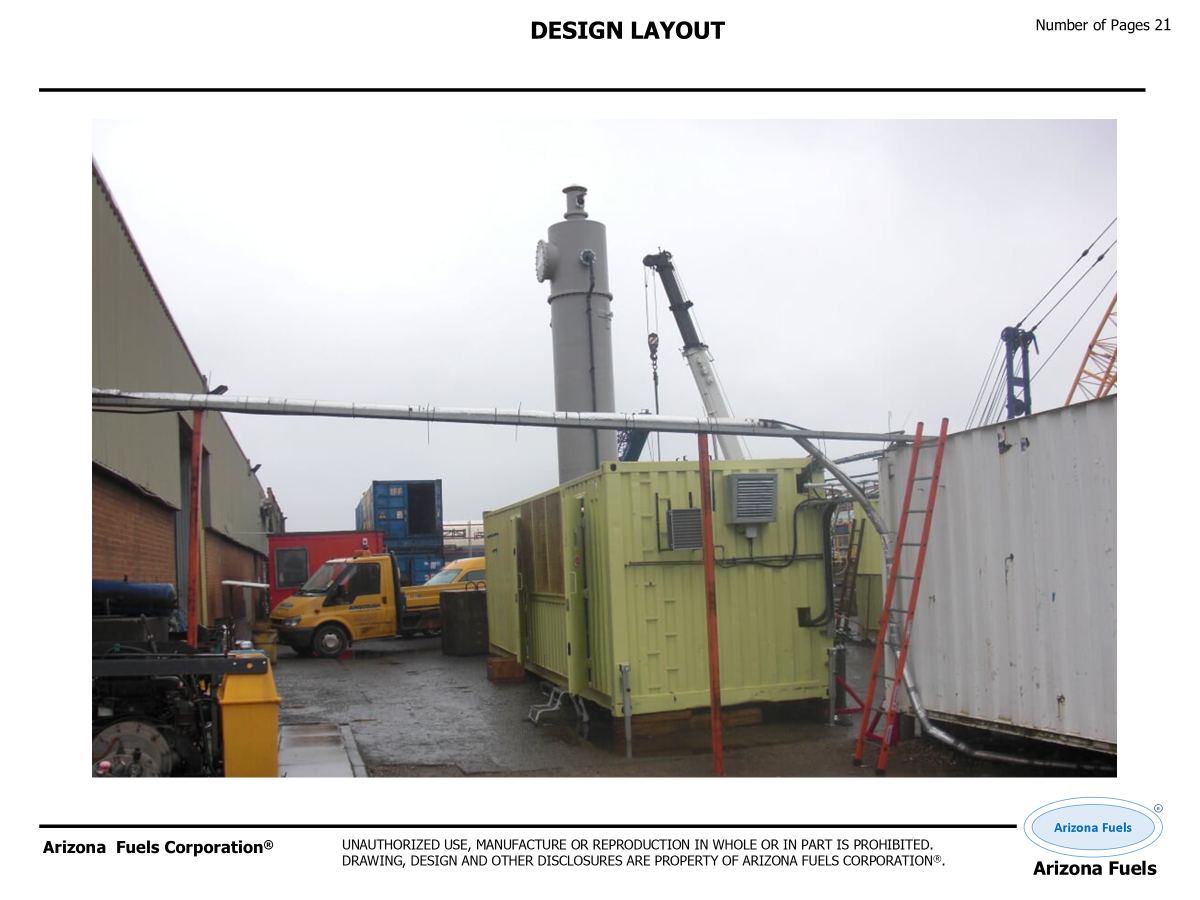
External view of the UK pilot plant installation, showing the modular containerised structure and associated tall process stack.
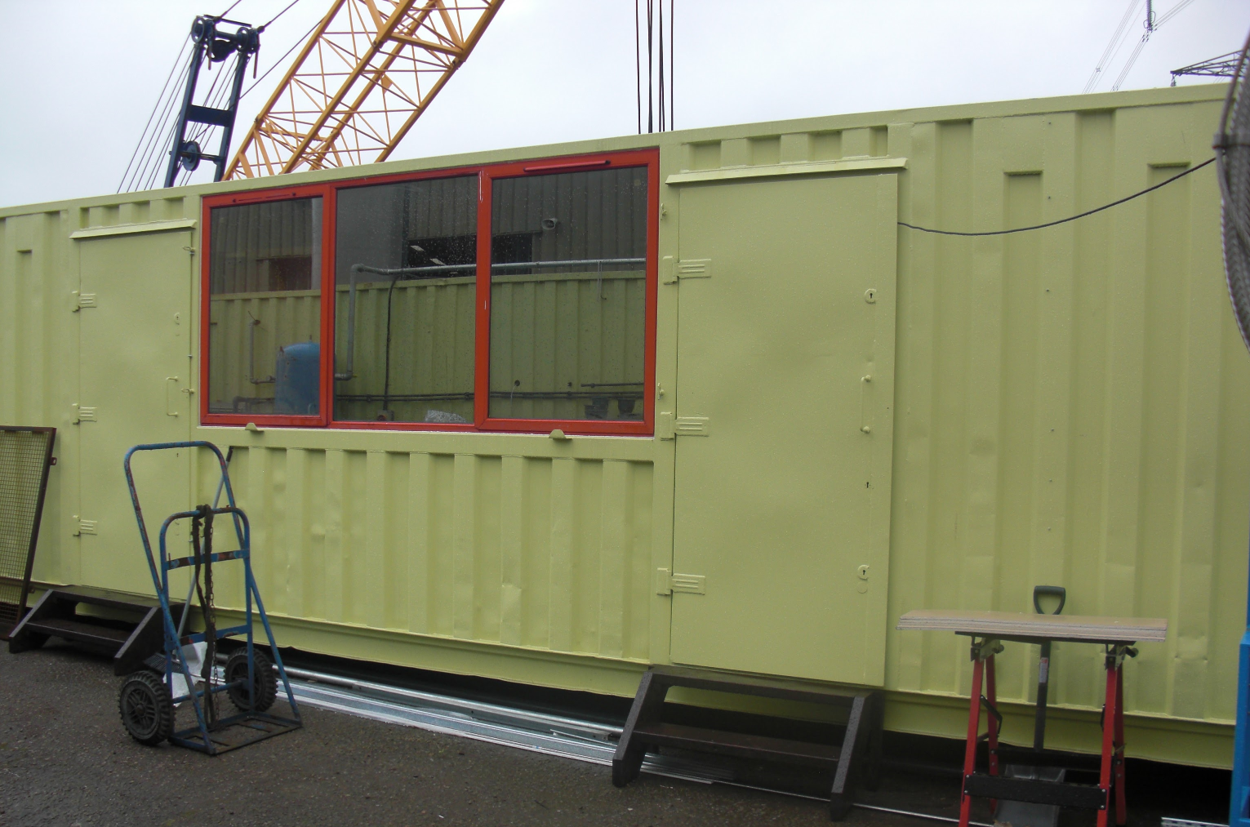
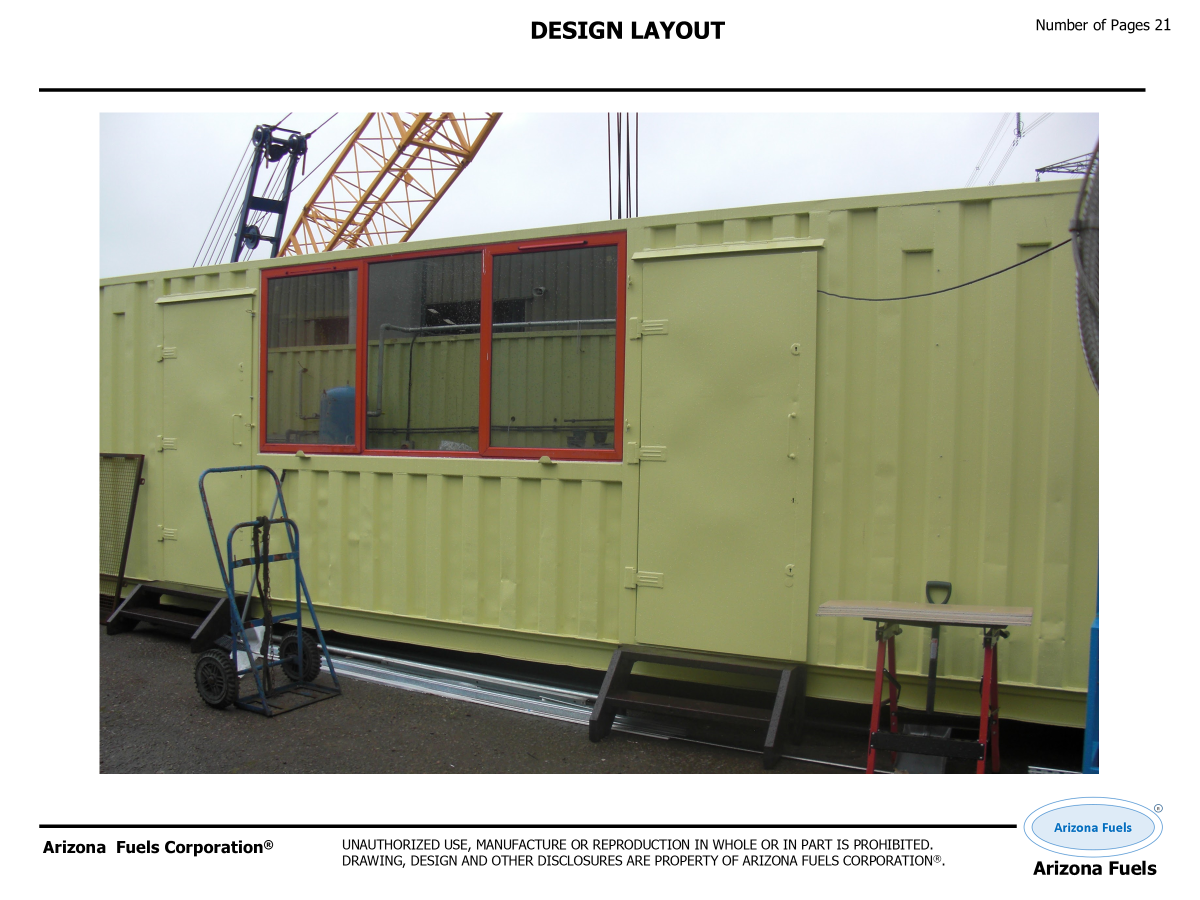
Side elevation of the containerised pilot plant with access door, inspection window, and the rugged transportable enclosure.
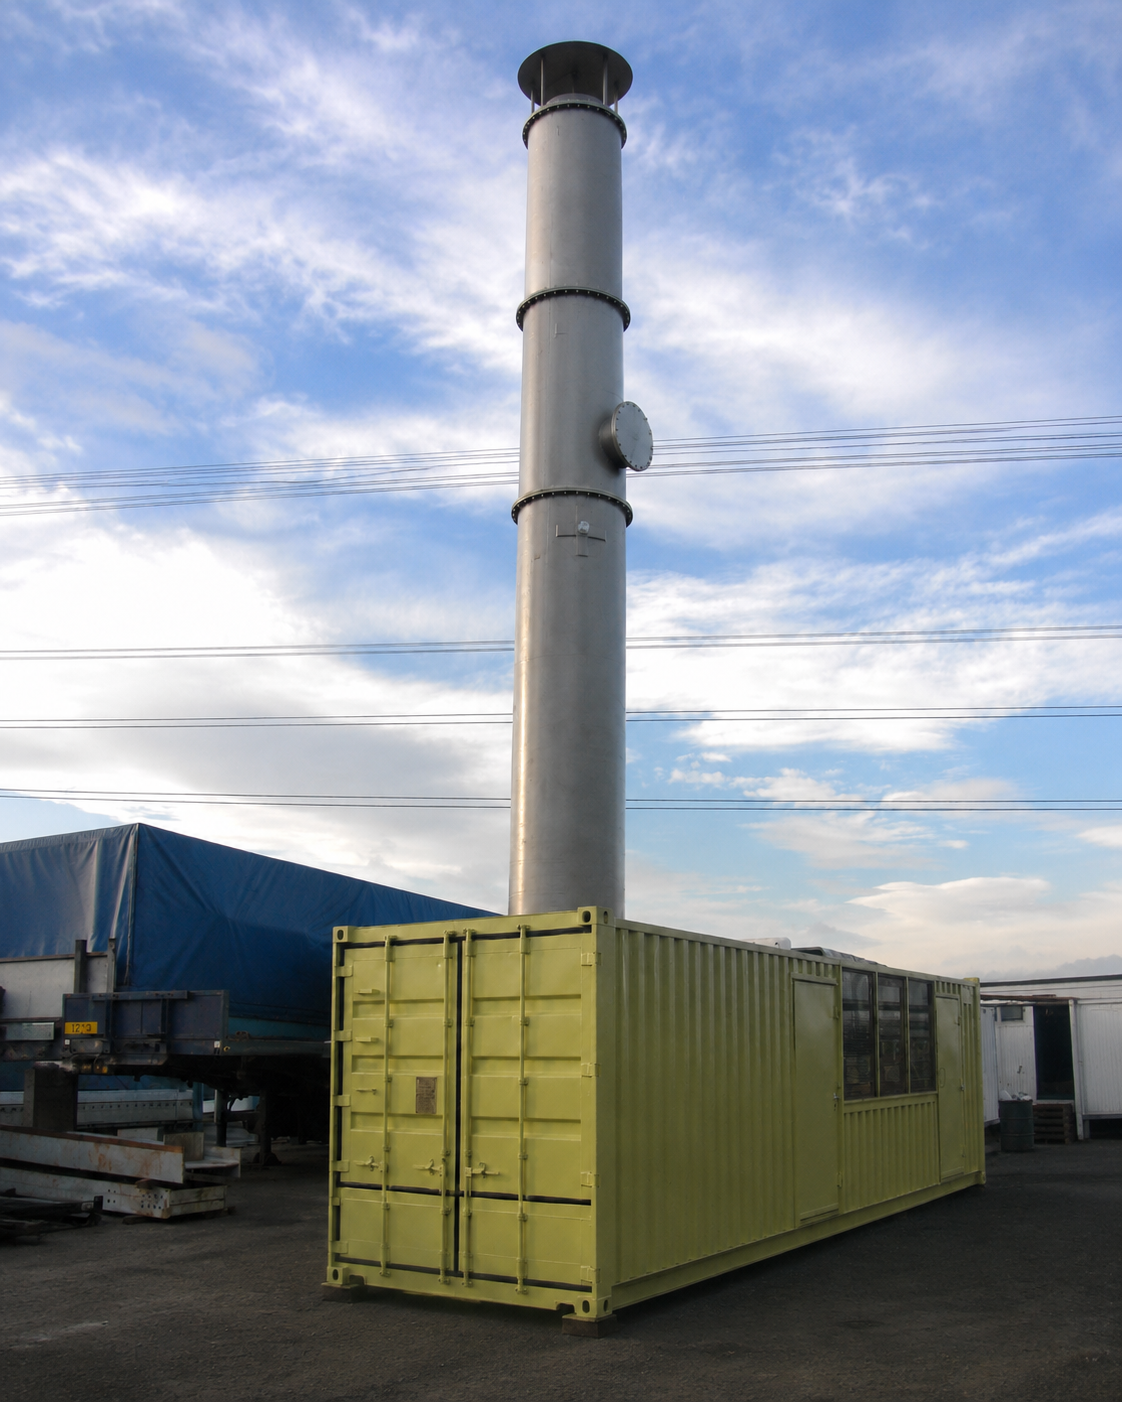
A full external view of the UK pilot plant with its high vertical stack, illustrating the scale and modular deployment concept.
Detailed view of the pilot plant interior, showing the control console, transparent process vessels, and integrated equipment used for capture and treatment operations.
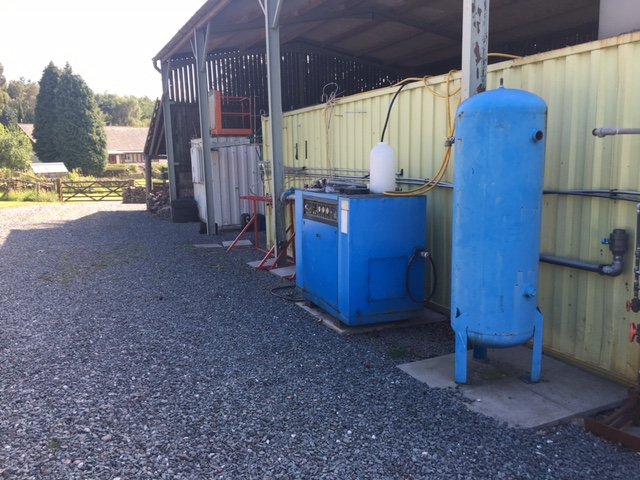
Outdoor support equipment beside the containerized unit, including a blue service skid and vertical pressure vessel that support plant operation.
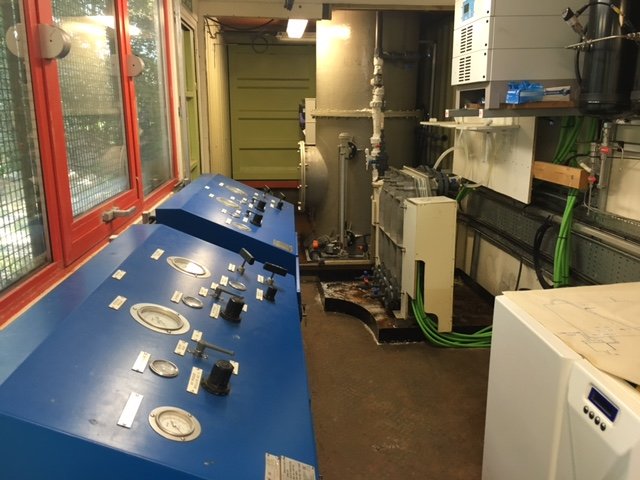
Interior view down the operator side of the plant, with the blue control consoles, process hardware, and service connections arranged in a compact layout.
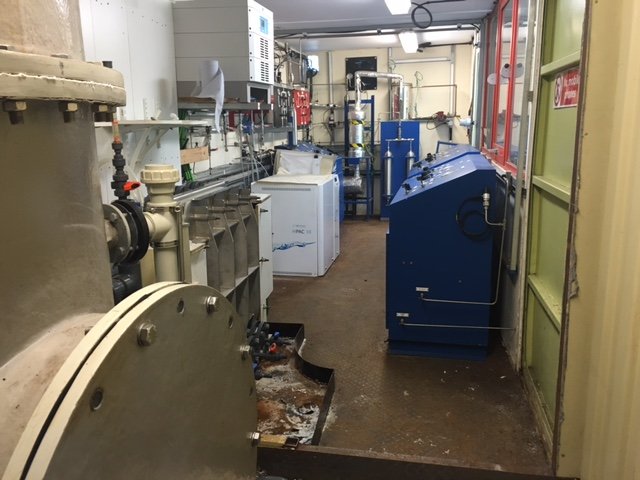
A longer perspective through the pilot plant showing the reactor bay, control panels, and supporting equipment installed within the modular container.
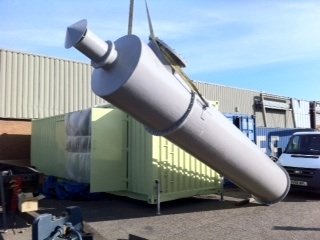
The full-height process tower shown during installation, illustrating the scale of the major vertical hardware associated with the pilot plant.
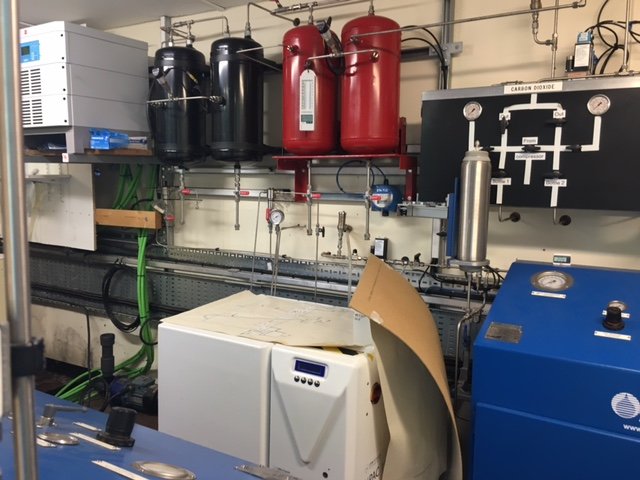
Black and red pressure vessels, gauges, and line diagrams forming part of the gas handling and conditioning system.
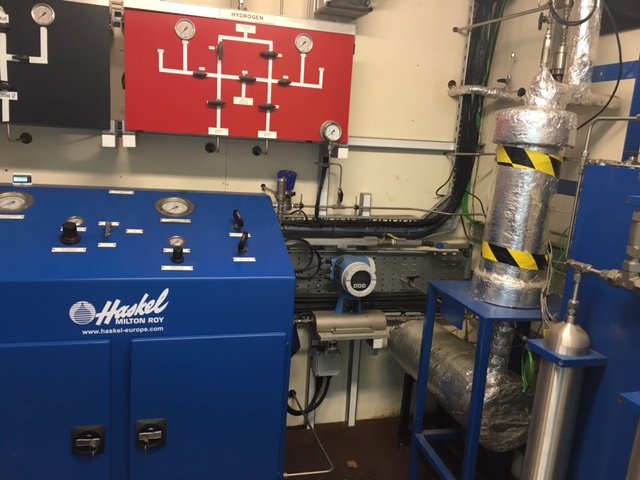
Blue Haskel pressure unit and hydrogen control panel used for gas management, regulation, and safe process operation.
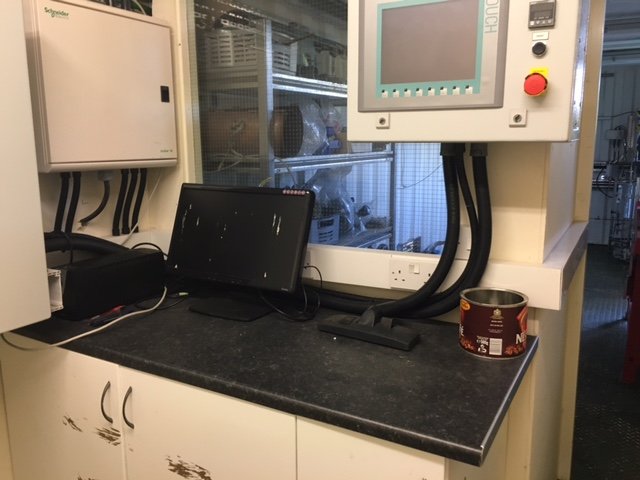
Instrumentation and touchscreen control interface used for plant supervision, monitoring, and analytical support.
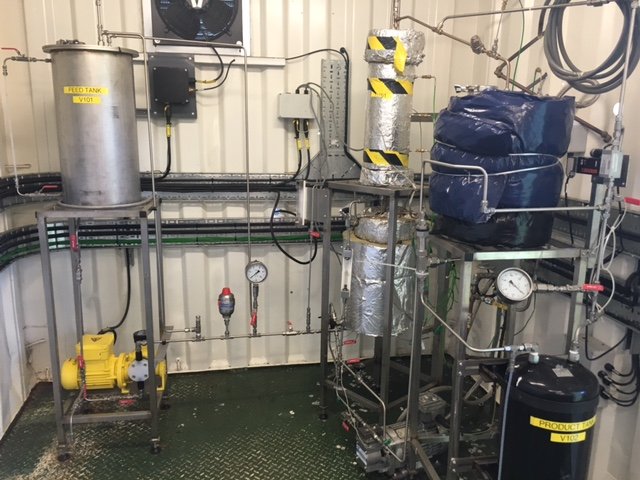
A dedicated equipment skid with feed tank, insulated process components, and product vessel used during pilot-scale testing and operation.
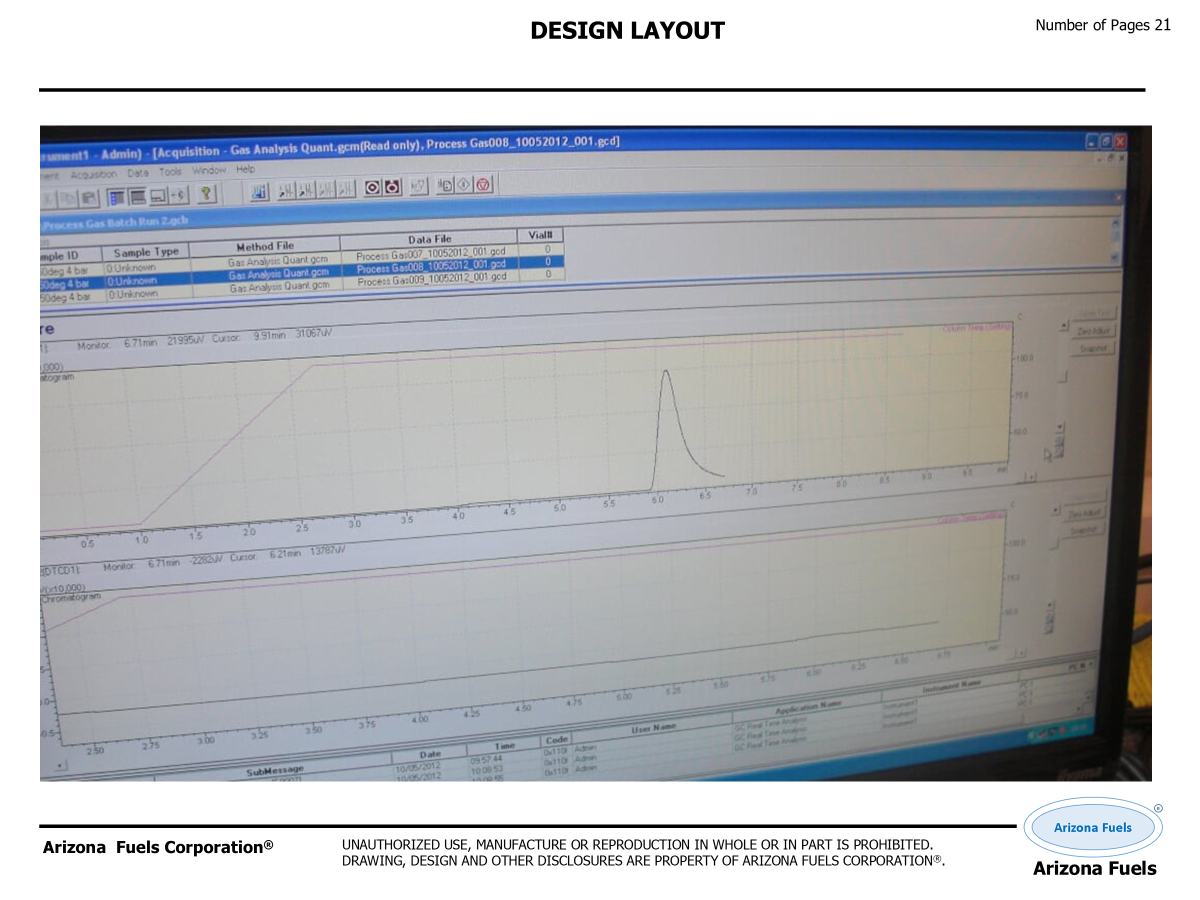
Documented layout view of the gas storage and service manifold arrangement used in the UK pilot plant design package.
The detailed process route, energy balance, schematics and test data are available to authorised users. Log in, or request the technical physics and chemistry background and the test reports from info@fuelfromair.com.
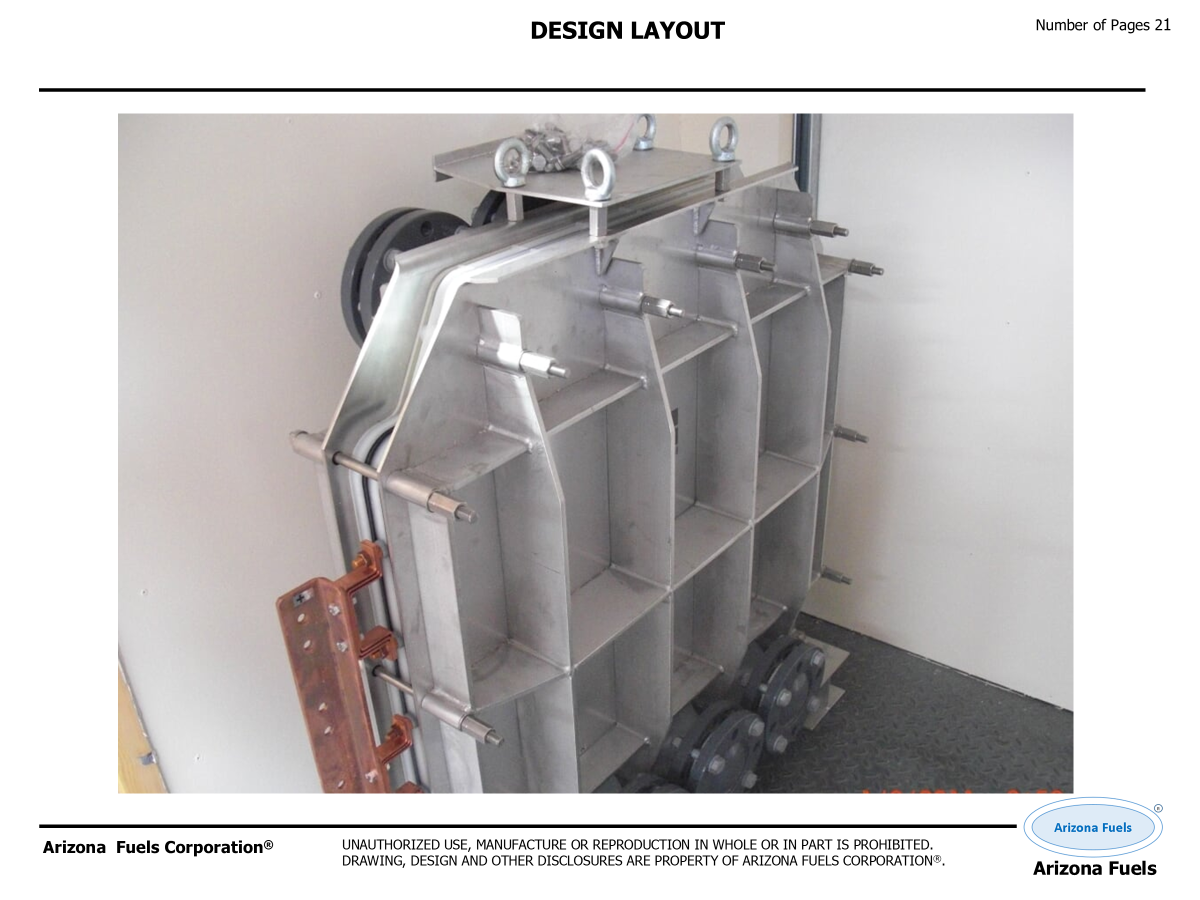
Engineering layout view of a fabricated metallic process component developed for pilot-scale testing and fluid handling.
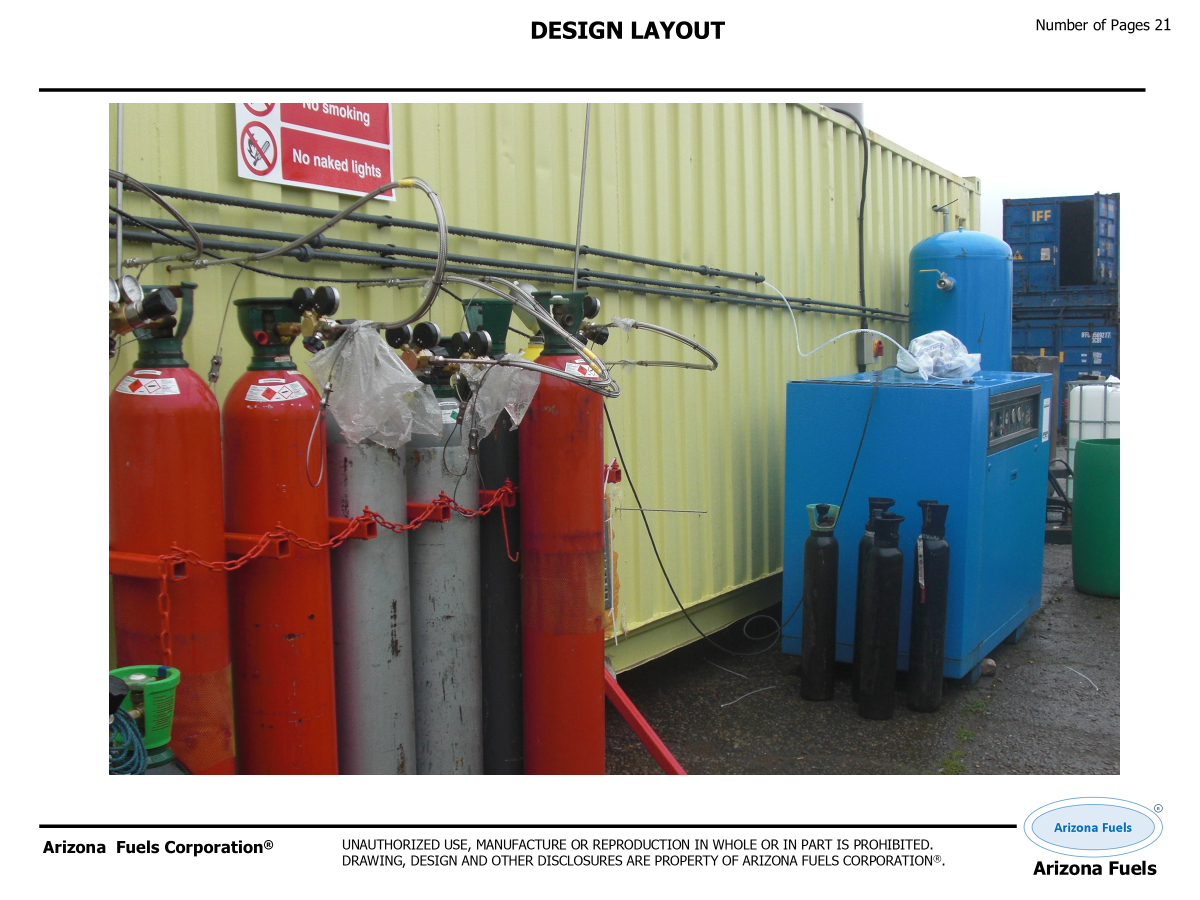
Documented view of the gas cylinder and utility skid area supporting pilot plant services and feed supply.
Project layout image showing the modular plant on site together with the associated vertical stack and external pipework.
Side elevation of the containerized pilot unit, showing the access door, window section, and transportable outer shell.
Another documented interior view highlighting the pilot process rig, utility piping, and equipment arrangement under operating conditions.
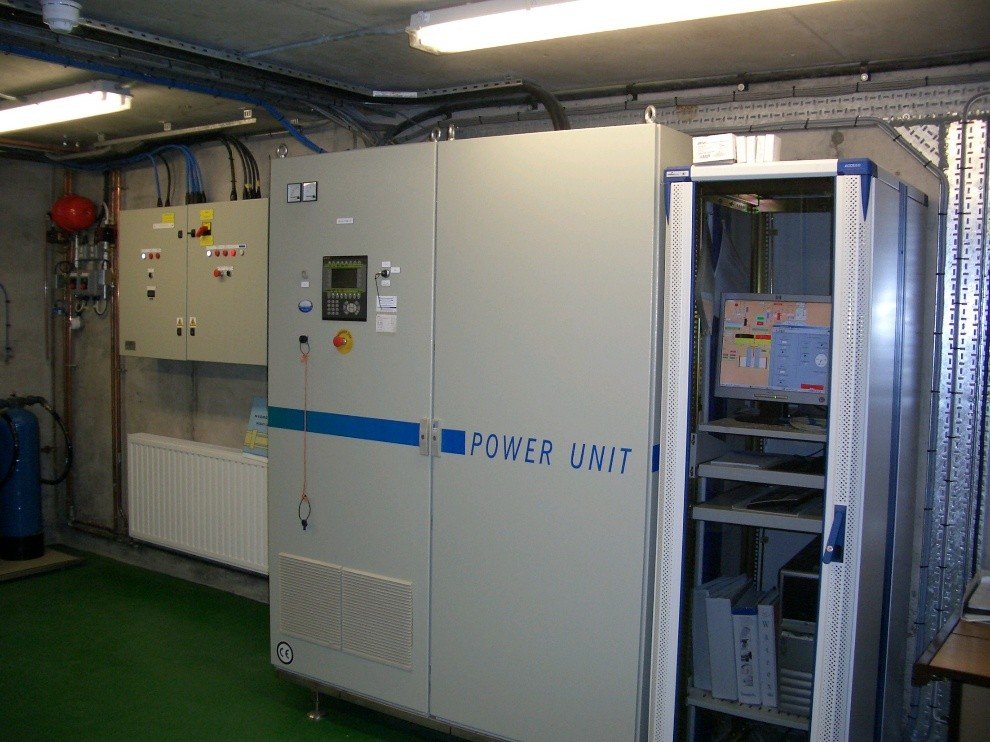
Power electronics and control cabinet for the UK pilot plant, showing the electrical control hardware used to manage plant operation, monitoring and process power distribution.
A compelling solution at the intersection of climate responsibility and commercial value.
See the numbers →| Section | Source / Process | Claim or Calculation | Quantity | Unit | Notes / Formula Basis |
|---|---|---|---|---|---|
| The Physics of Transportation | Zero-ethanol gasoline | 1 gallon produces | 17.4 | lbs CO2 | Per gallon of fuel |
| The Physics of Transportation | Diesel | 1 gallon produces | 22.0 | lbs CO2 | Per gallon of fuel |
| The Physics of Transportation | Passenger car | Each passenger car produces | 8,188.0 | lbs CO2 / year | Base 12,000 miles/year and 25.5 mpg |
| The Physics of Transportation | USA ground transportation | CO2 produced during 2015 | 1,700.0 | million tons CO2 | USA ground transportation |
| The Physics of Transportation | Worldwide flights | CO2 produced during 2015 | 770.0 | million tons CO2 | Flights around the world |
| FFA Air to Fuel Synthesis | FFA gasoline production | Producing 1 gallon consumes | 28.0 | lbs CO2 | CO2 consumed during synthesis |
| FFA Air to Fuel Synthesis | FFA gasoline production | Producing 1 gallon vents | 20.1 | lbs O2 | Oxygen vented back to atmosphere |
| FFA Air to Fuel Synthesis | Car using FFA fuel | Each car will remove | 13,176.0 | lbs CO2 / year | Base 470.6 gallons/year × 28 lbs CO2/gallon |
| FFA Air to Fuel Synthesis | USA car fleet using FFA fuel | Fleet will remove | 2,423.0 | million tons CO2 / year | USA car fleet |
| FFA Air to Fuel Synthesis | World aircraft fleet using FFA fuel | Fleet will remove | 1,097.0 | million tons CO2 / year | World aircraft fleet |
| Metric | Value | Unit | Notes |
|---|---|---|---|
| Gasoline CO2 production | 17.4 | lbs CO2 / gallon | Zero-ethanol gasoline |
| FFA CO2 consumption | 28.0 | lbs CO2 / gallon | Per gallon of FFA gasoline produced |
| Net CO2 benefit vs gasoline production | 45.4 | lbs CO2 / gallon | FFA consumption plus avoided gasoline emissions |
| Annual gasoline use per passenger car | 470.6 | gallons/year | 12,000 miles/year ÷ 25.5 mpg |
| Annual CO2 removal per FFA car | 13,176 | lbs CO2/year | Annual gallons × 28 lbs CO2/gallon |
This slide explains the scale of the opportunity behind air-to-fuel synthesis. It compares the CO₂ released by conventional gasoline, diesel, passenger cars and aviation with the proposed AFC fuel pathway, where producing fuel consumes captured CO₂ and returns oxygen to the atmosphere. The meaning for Section 03 is that the business case is not only fuel production: it is also carbon removal, transport-sector decarbonisation, and a route to cleaner liquid fuels for cars, aircraft and other hard-to-electrify applications.
CO₂ is abundant and increasingly expensive to emit — turning an emission liability into a valuable raw material.
Drop-in hydrocarbons can work with existing refineries, pipelines, storage, and engines.
Produces high-value fuels for transportation, aviation, marine, and industrial applications.
One PDF for each major location: Scottsdale, Cambodia and Singapore, plus the top ten locations from the Market Analysis ranking three more major cities (Berlin, Rio de Janeiro and Mumbai), and five European cities (London, Cuxhaven, Madrid, Rome and Paris). Every PDF is the User Location Analysis for that site, in US gallons. Click a box to open it.
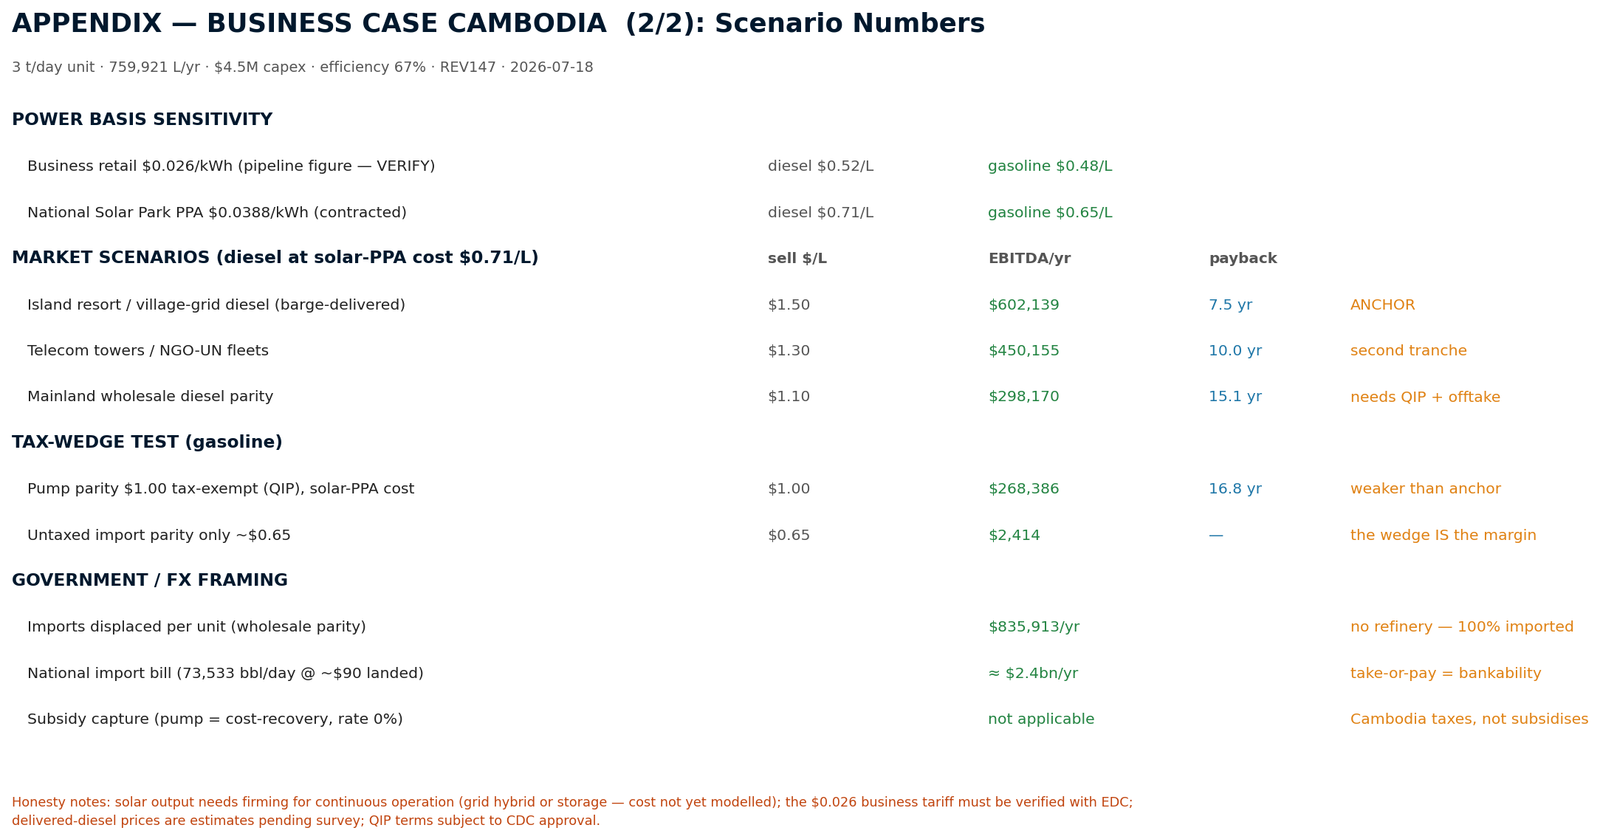
Ranked case: 1. island delivered diesel (anchor) · 2. QIP tax wrapper (9-yr holiday, duty-free equipment) · 3. EDC take-or-pay for bankability (no refinery — ~$2.4bn/yr imported) · 4. gasoline mass market is the policy story, not the profit engine (smuggling undercuts formal retail — sell B2B) · 5. Angkor/Techo SAF later. Subsidy capture: not applicable (Cambodia taxes, does not subsidise).
| Plant size | |
| Power basis | |
| Fuel | |
| Market | |
Honesty notes: solar needs firming for continuous operation (cost not modelled); the business tariff must be verified with EDC; delivered-diesel prices are estimates pending survey; QIP subject to CDC approval. Sequence: $425k demonstrator on Koh Rong → first unit against resort offtakes → QIP → EDC take-or-pay for units 2–4.
All figures at the contracted National Solar Park PPA (ADB-backed) — the defensible power basis. Diesel cost $0.71/L · gasoline $0.65/L
Koh Rong archipelago resorts and village grids run on barge-delivered genset diesel at ~$1.50/L. A 3 t/day unit on-island selling at delivered parity: EBITDA $602k/yr, payback 7.5 years — Cambodia's best pure-market number, no policy needed. Second tranche: telecom towers and NGO/UN fleets at ~$1.30/L (10-yr payback). Tourism 'carbon-neutral island' premium on top.
Selling at pump parity tax-exempt earns only $268k EBITDA — at import parity the margin nearly vanishes, so the tax wedge is not the play. The real lever is Qualified Investment Project status: up to 9 years' profit-tax holiday plus duty-free import of plant equipment. Standard Cambodian law; boosts net profit through the payback years and trims effective capex.
Cambodia has no refinery; ~$2.4bn/yr of refined fuel is 100% imported. Each unit displaces ~$836k/yr at wholesale parity. A dollarized economy means no currency-crisis urgency — this sells as trade-balance and energy-security policy. Its practical value: an EDC / state take-or-pay offtake, converting merchant risk into bankable revenue and infrastructure-rate finance.
A motorbike economy: gasoline-heavy demand, and gasoline is FFA's cheapest product ($0.65 vs $1.00 pump). But smuggled Vietnamese/Thai fuel undercuts formal retail — sell B2B on contract, never fight the street. The affordability story (fuel falling from 36% to ~24% of a median wage even at solar-PPA cost) is the policy narrative, not the profit engine.
Book-and-claim sales to CORSIA-exposed carriers at Siem Reap and the new Phnom Penh airport. Real, but not the first dollar.
SEQUENCE: $425k demonstrator on Koh Rong itself (best economics, showcase) → first $4.5M unit against resort / island-grid offtakes → QIP certificate → EDC take-or-pay for units 2–4.
FFA deletes the first five layers of the import stack while the state keeps every cent of excise. FFA beats full import parity in 24/68 countries and the tax wedge alone in 35/63 taxed countries.
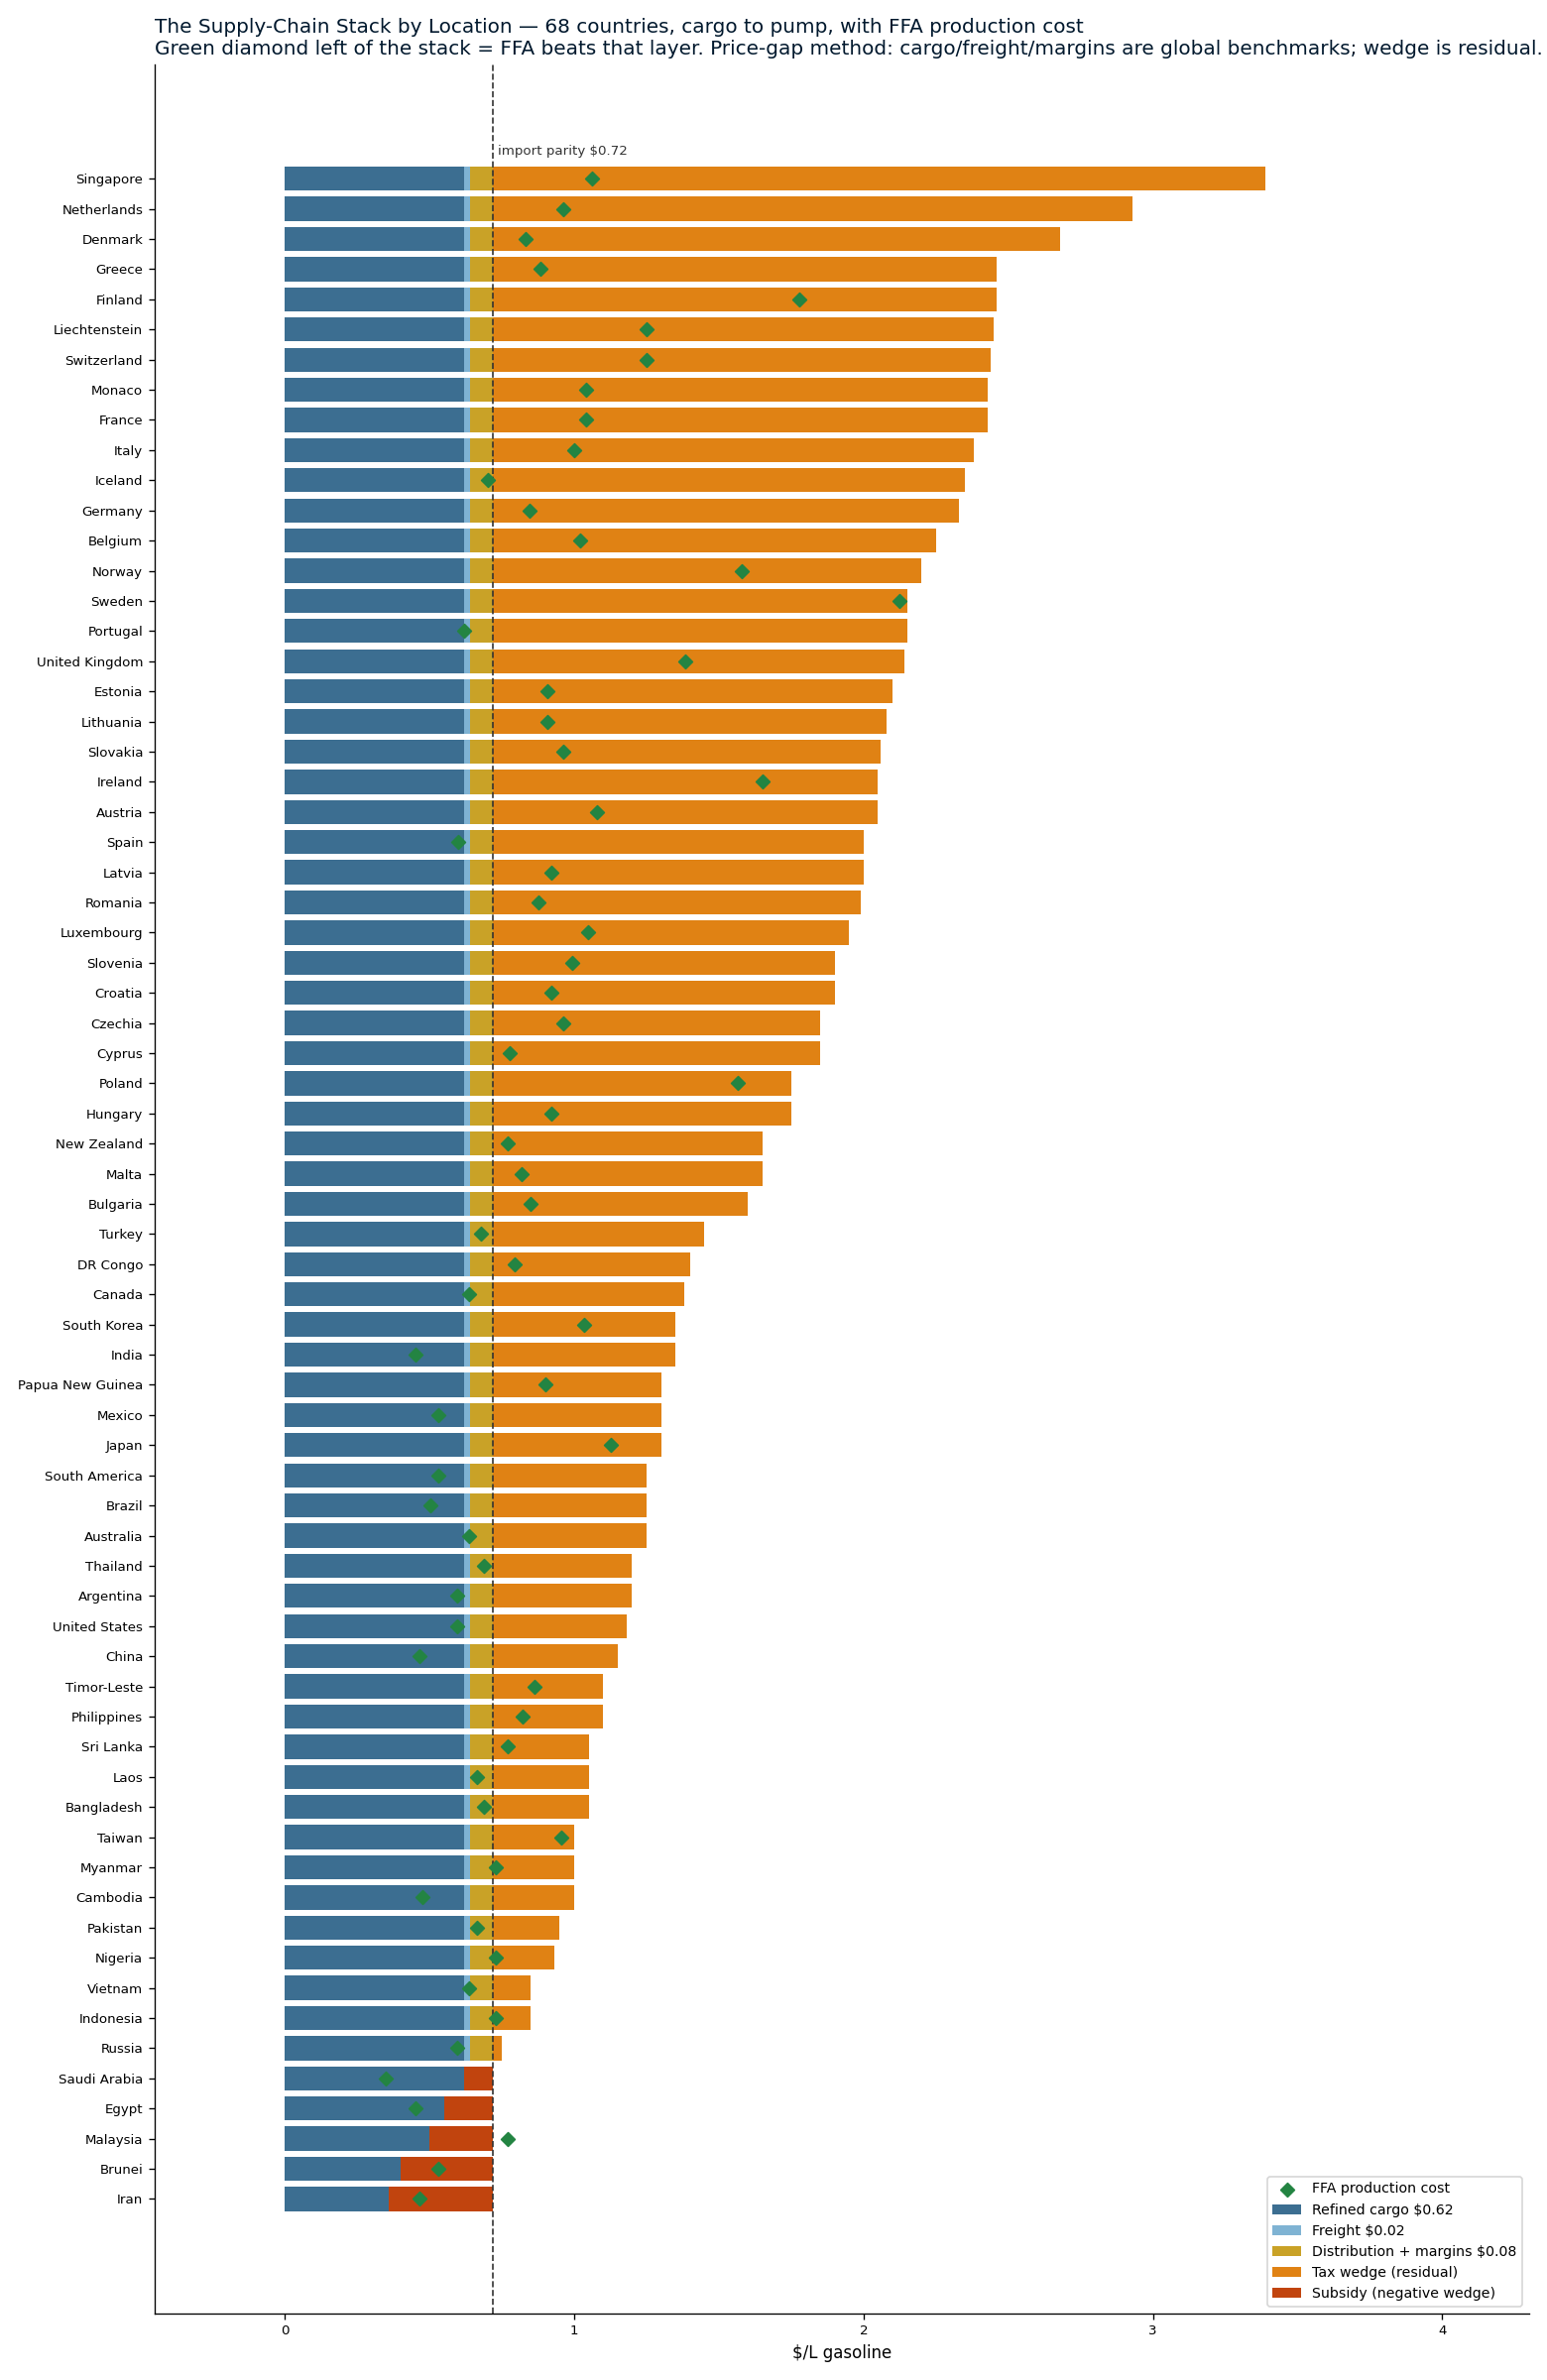
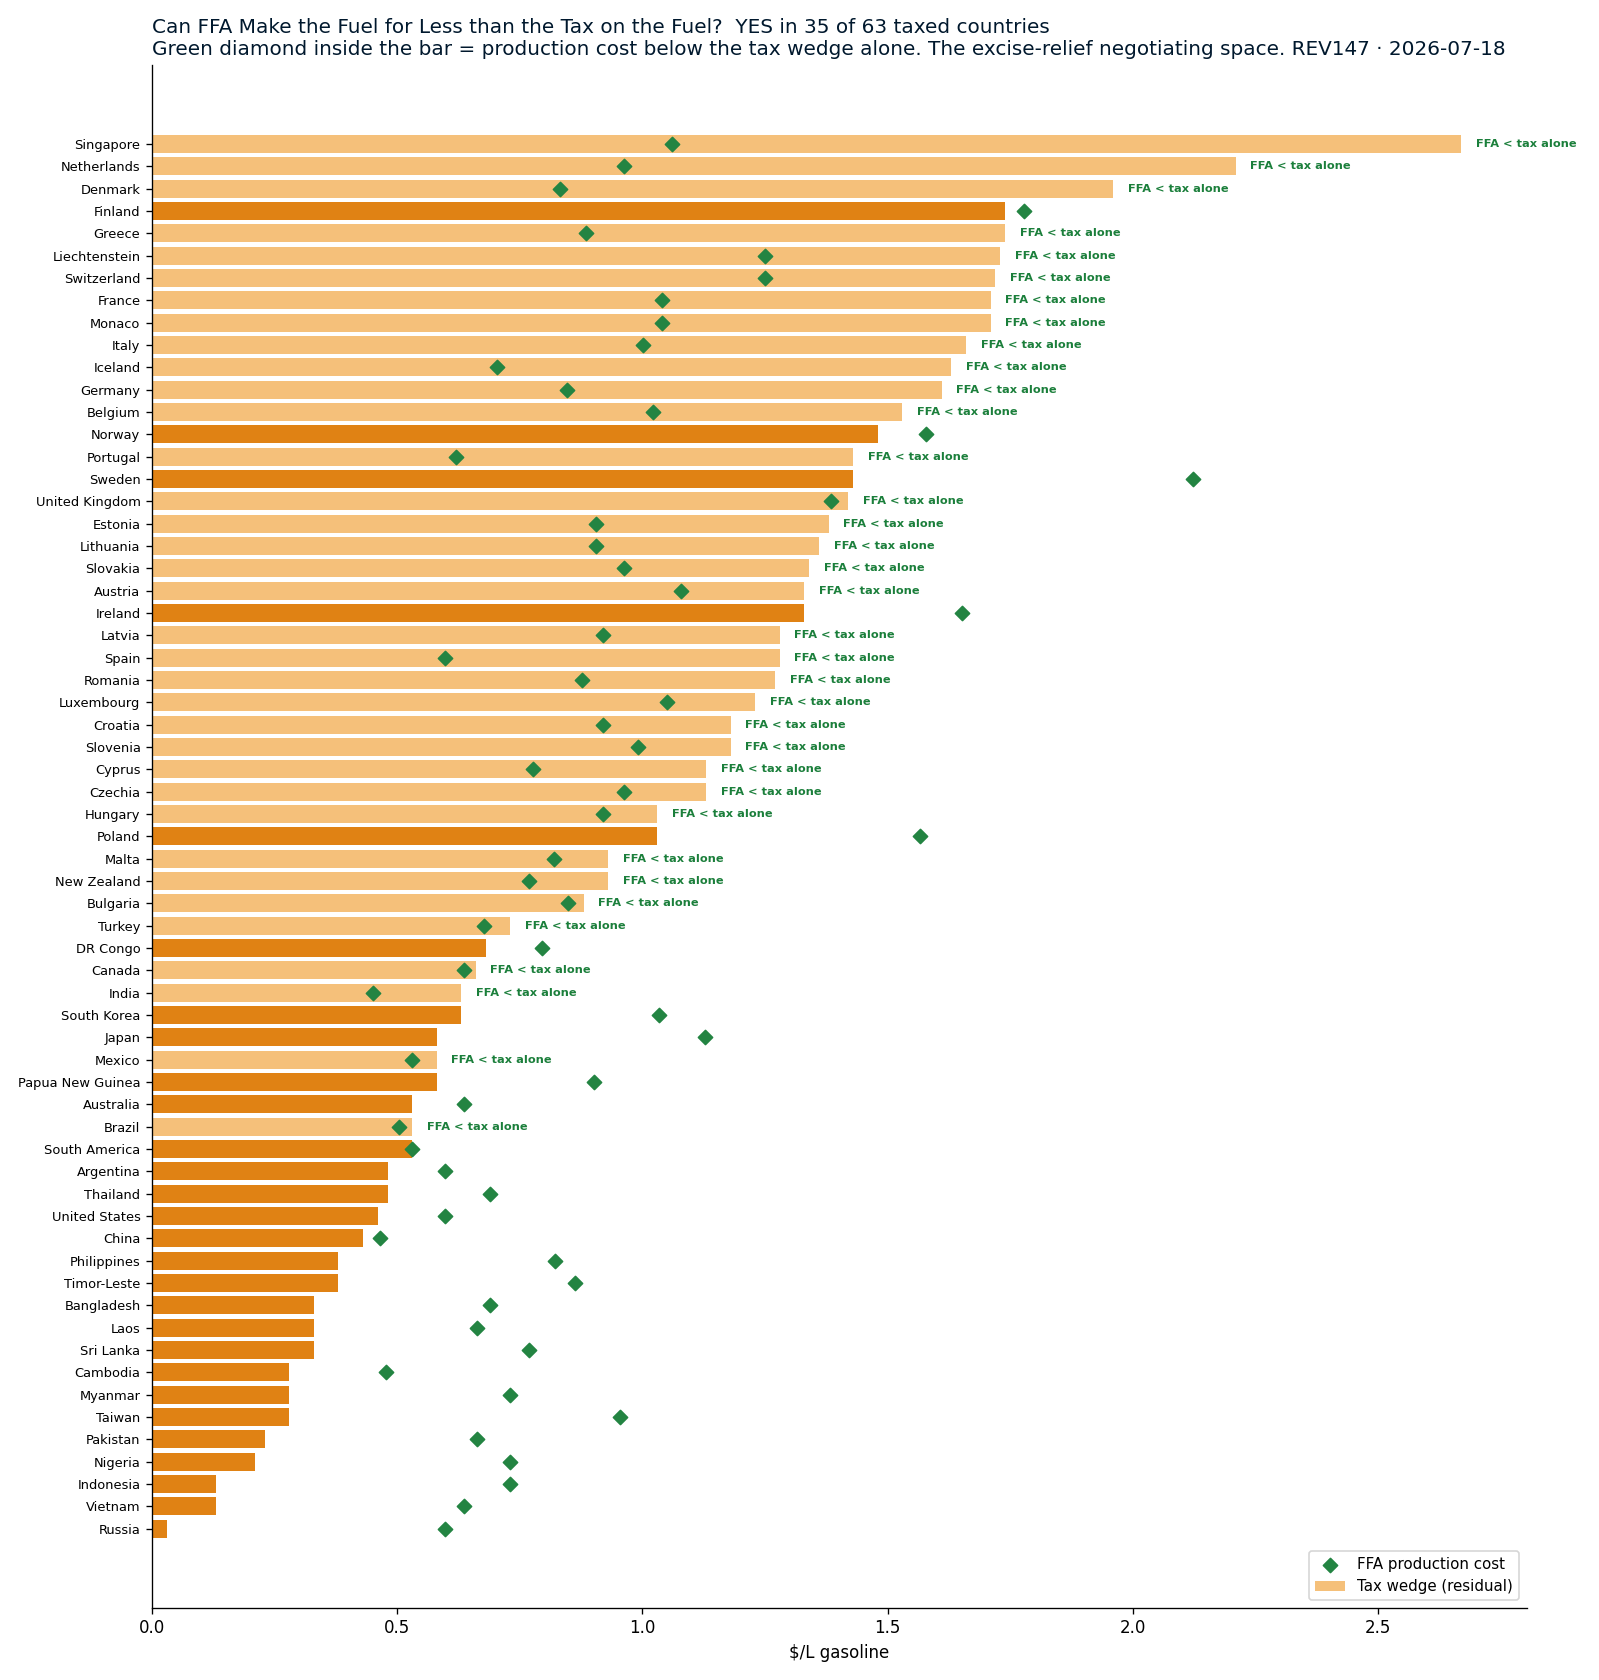
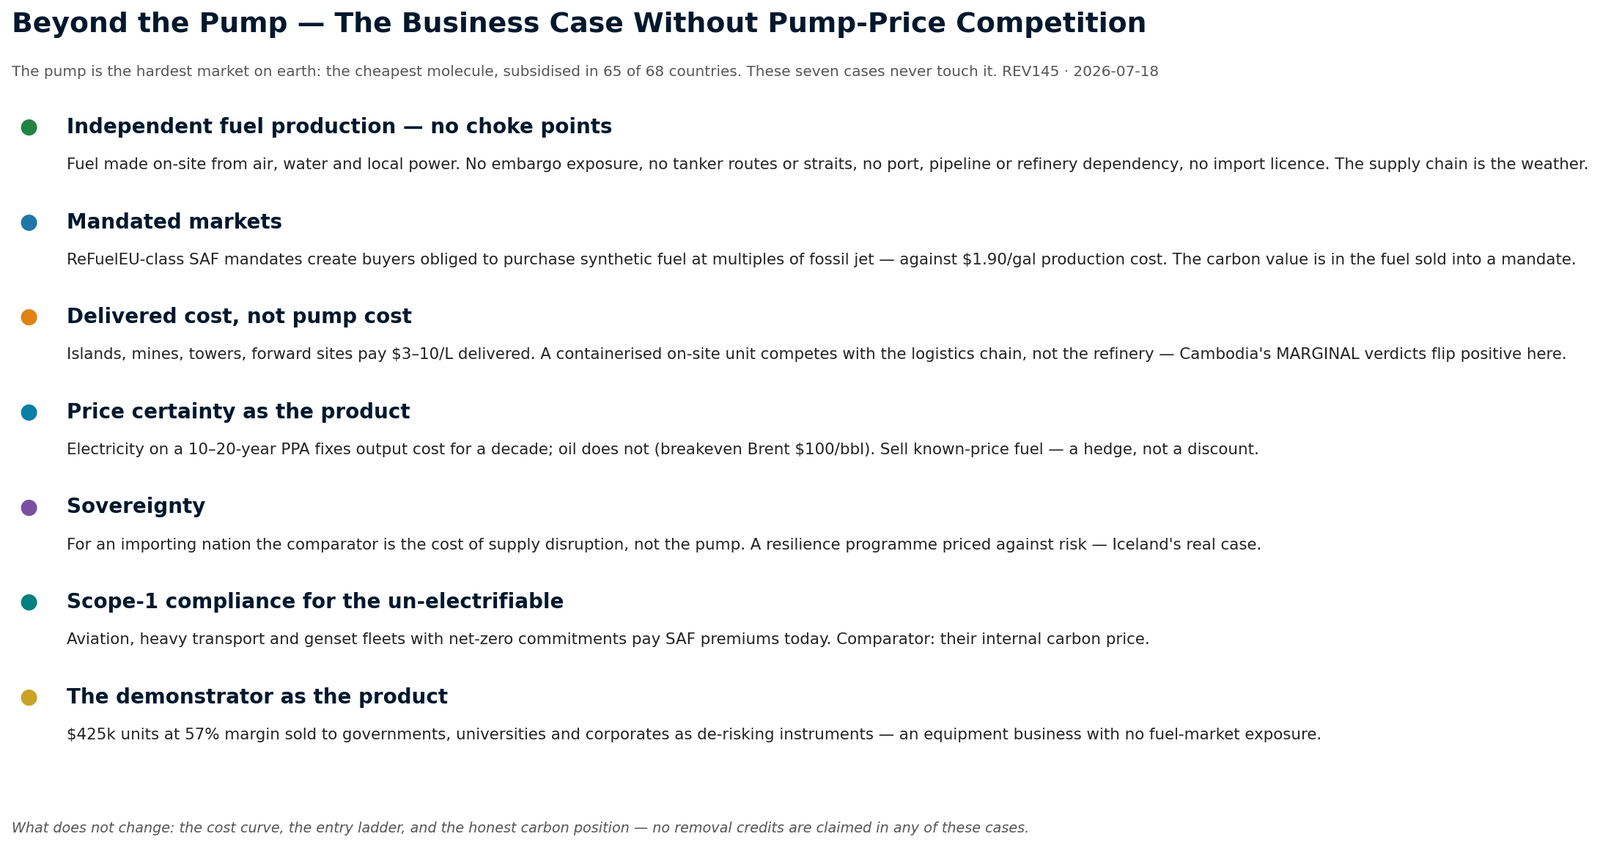
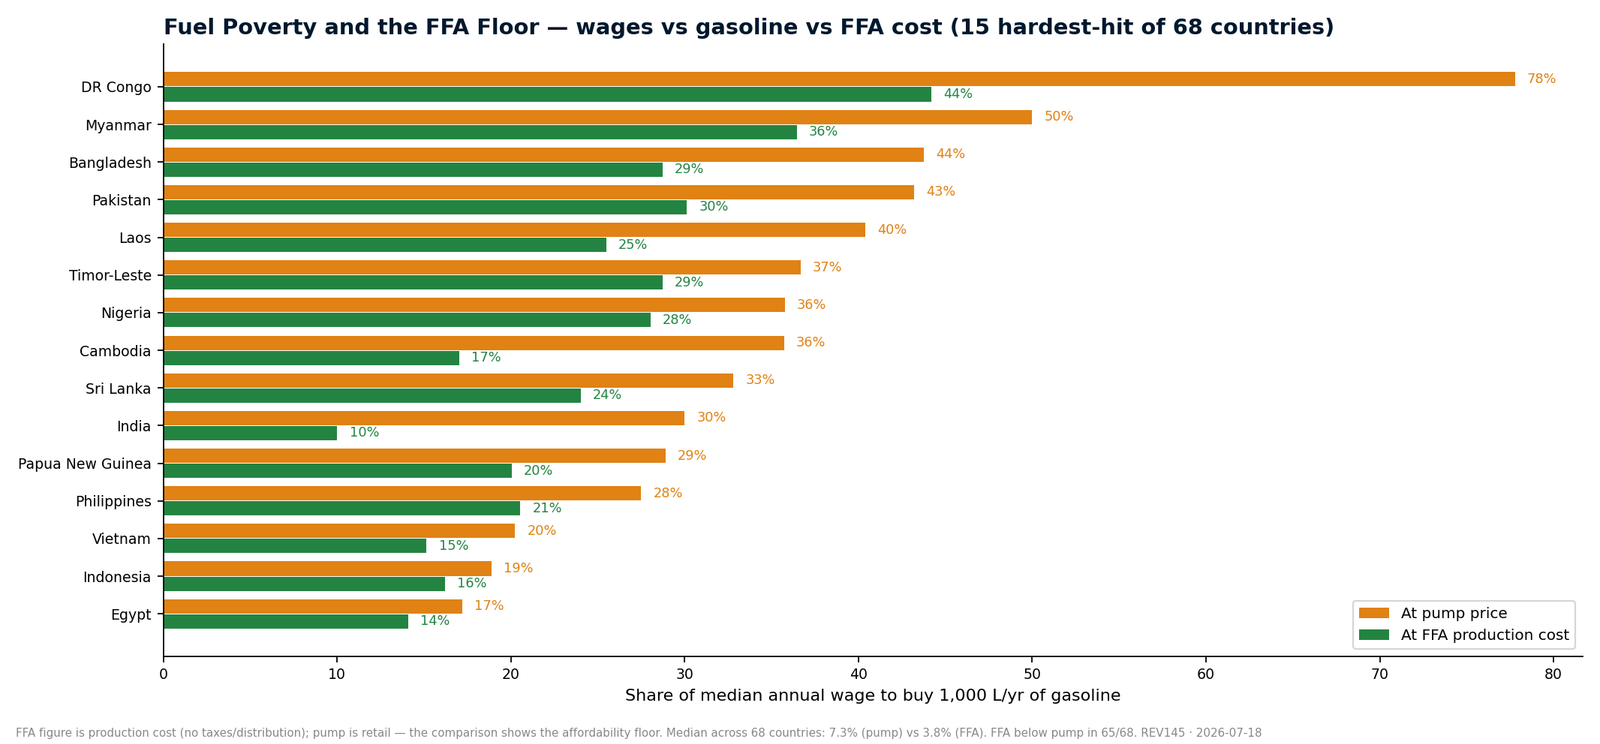
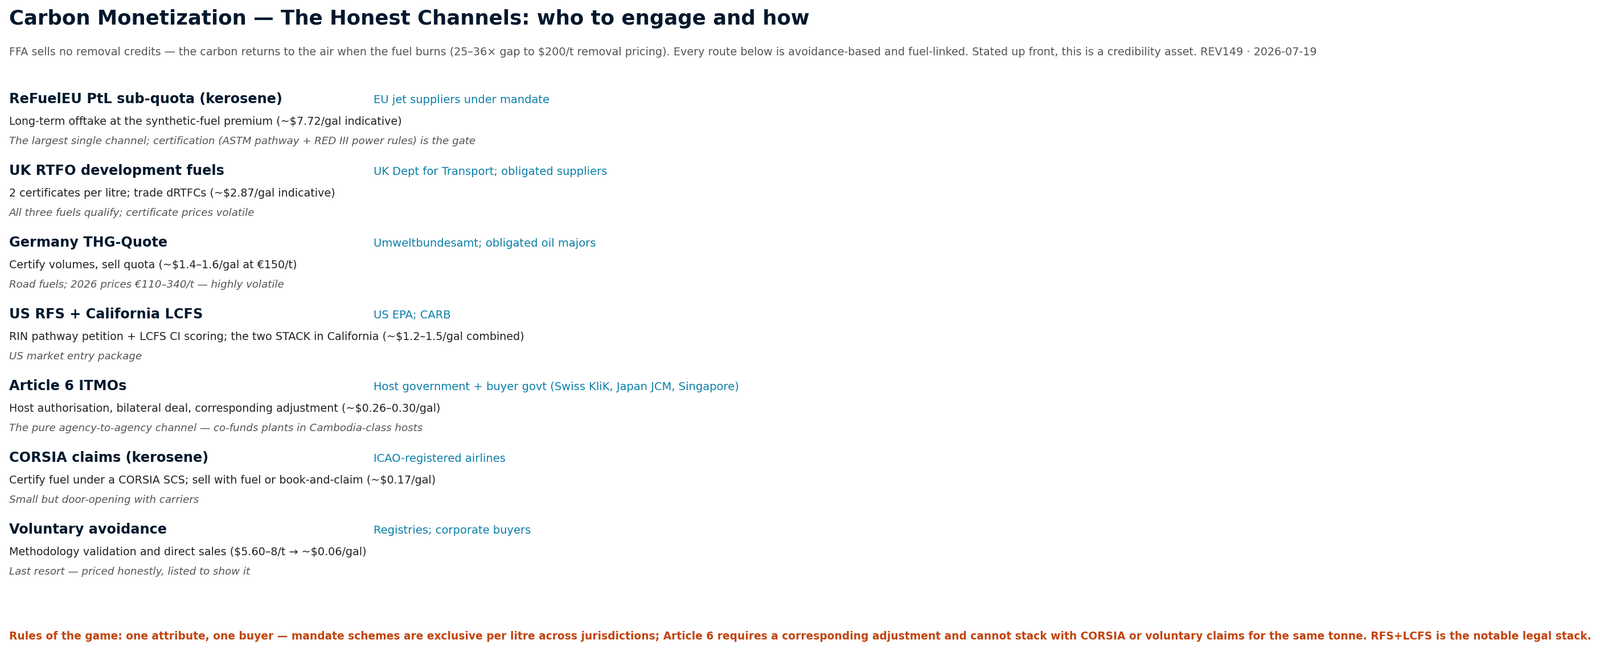
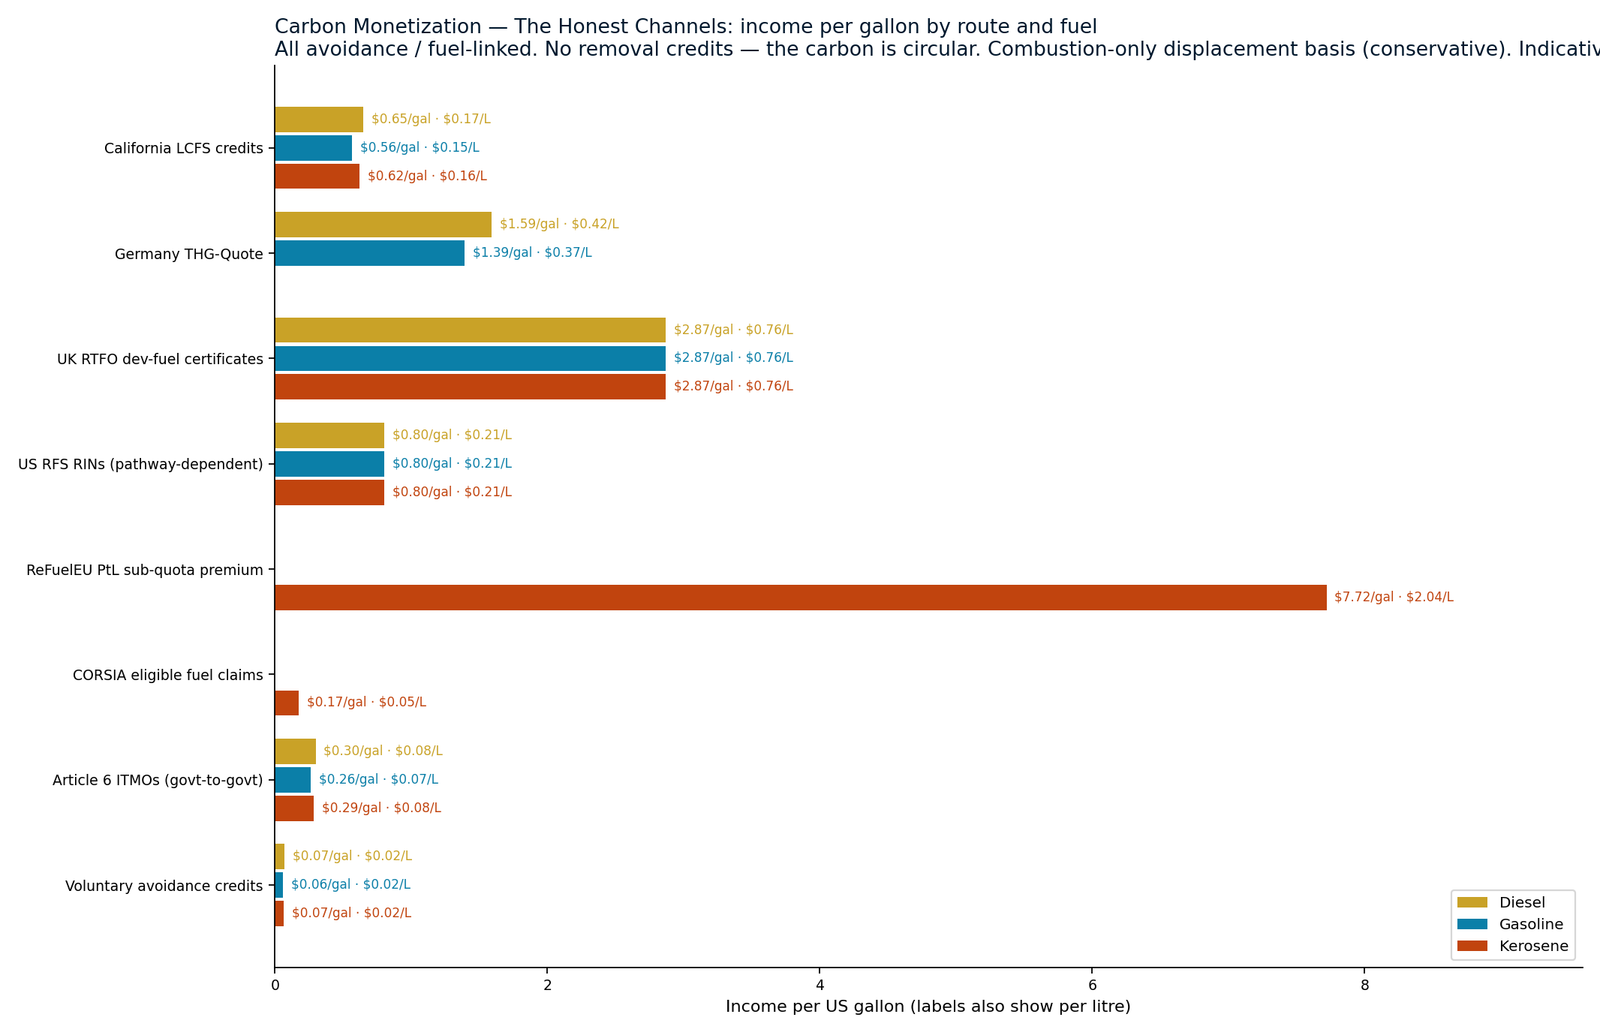
FFA sells no removal credits — the carbon is circular. Every channel below is avoidance-based and fuel-linked: mandate certificates, Article 6 government transfers, CORSIA, and honestly-priced voluntary avoidance. Indicative mid-2026 prices — verify at deal time.
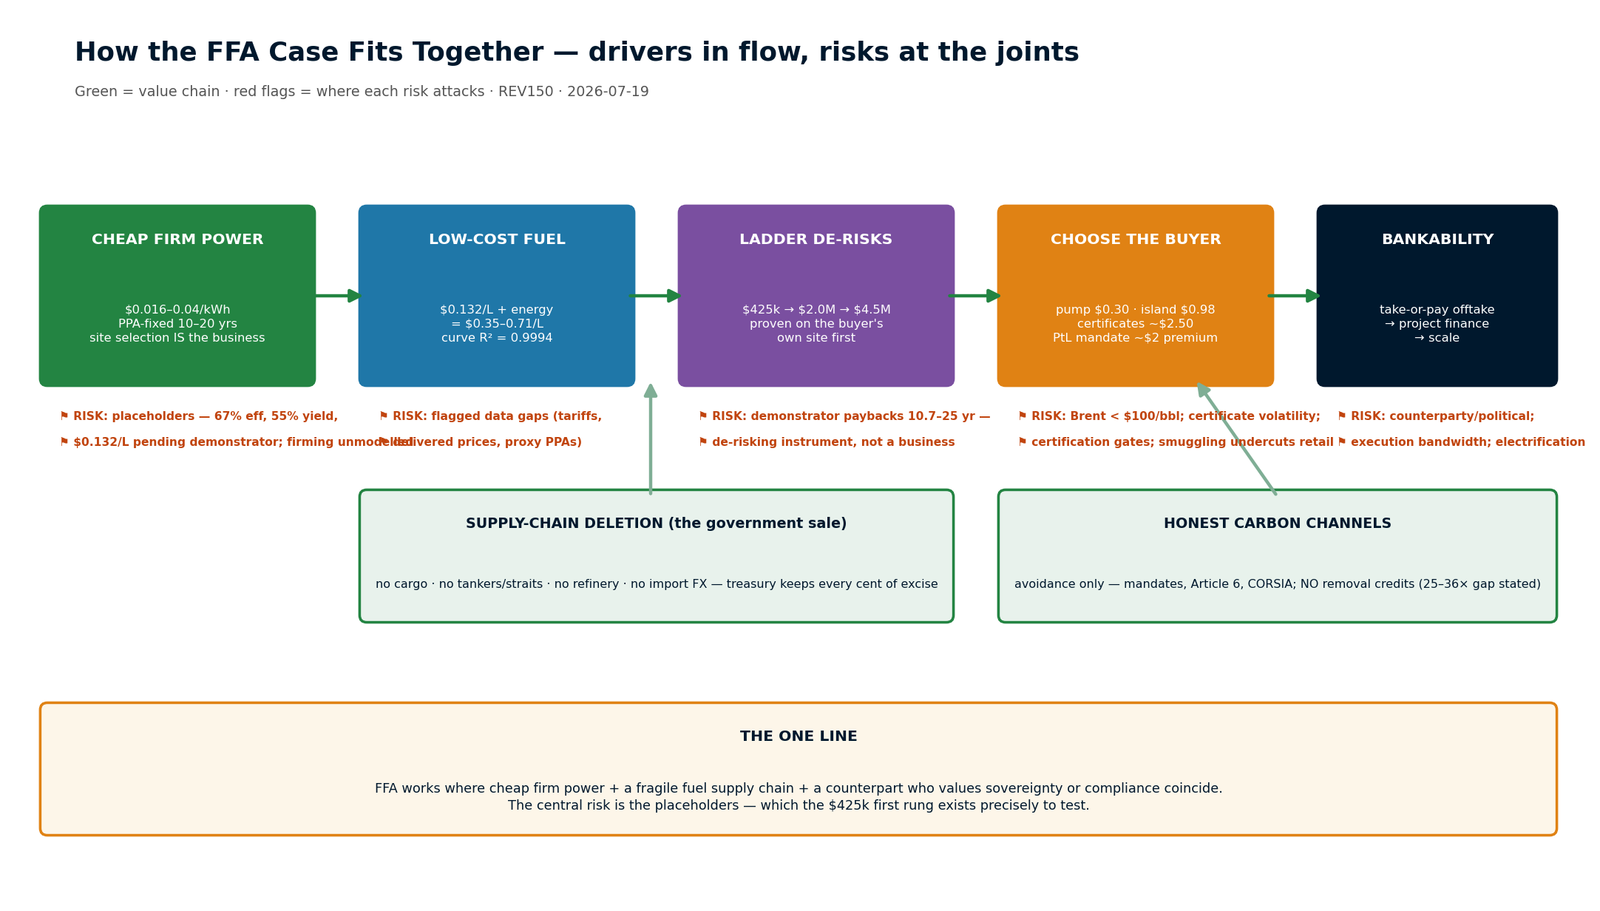
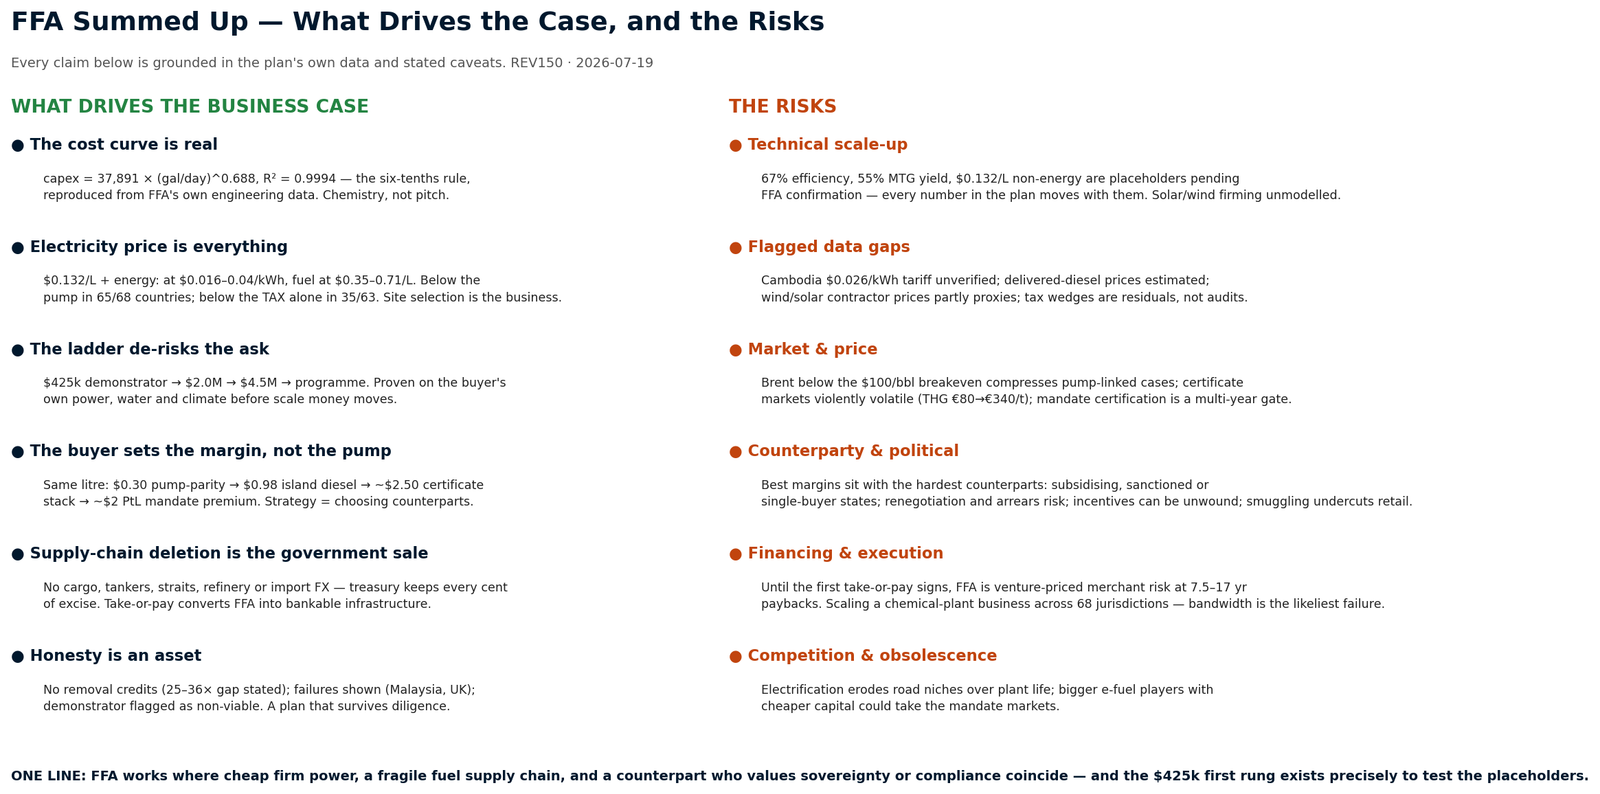
The whole case on one page — six drivers in flow, seven risks at the joints, and the one line that decides it.
Drop-in fuels for the world's most critical sectors and systems.
Explore applications →
BBC review of the factory presented in the gasoline box below. International interest in the results sparked media and investor interest.

Renewable gasoline for cars and sports vehicles tuned to get maximum engine performance.
Video clip added to the Gasoline application box, showing the AFS / Fuel From Air material as supporting media for liquid fuel applications.
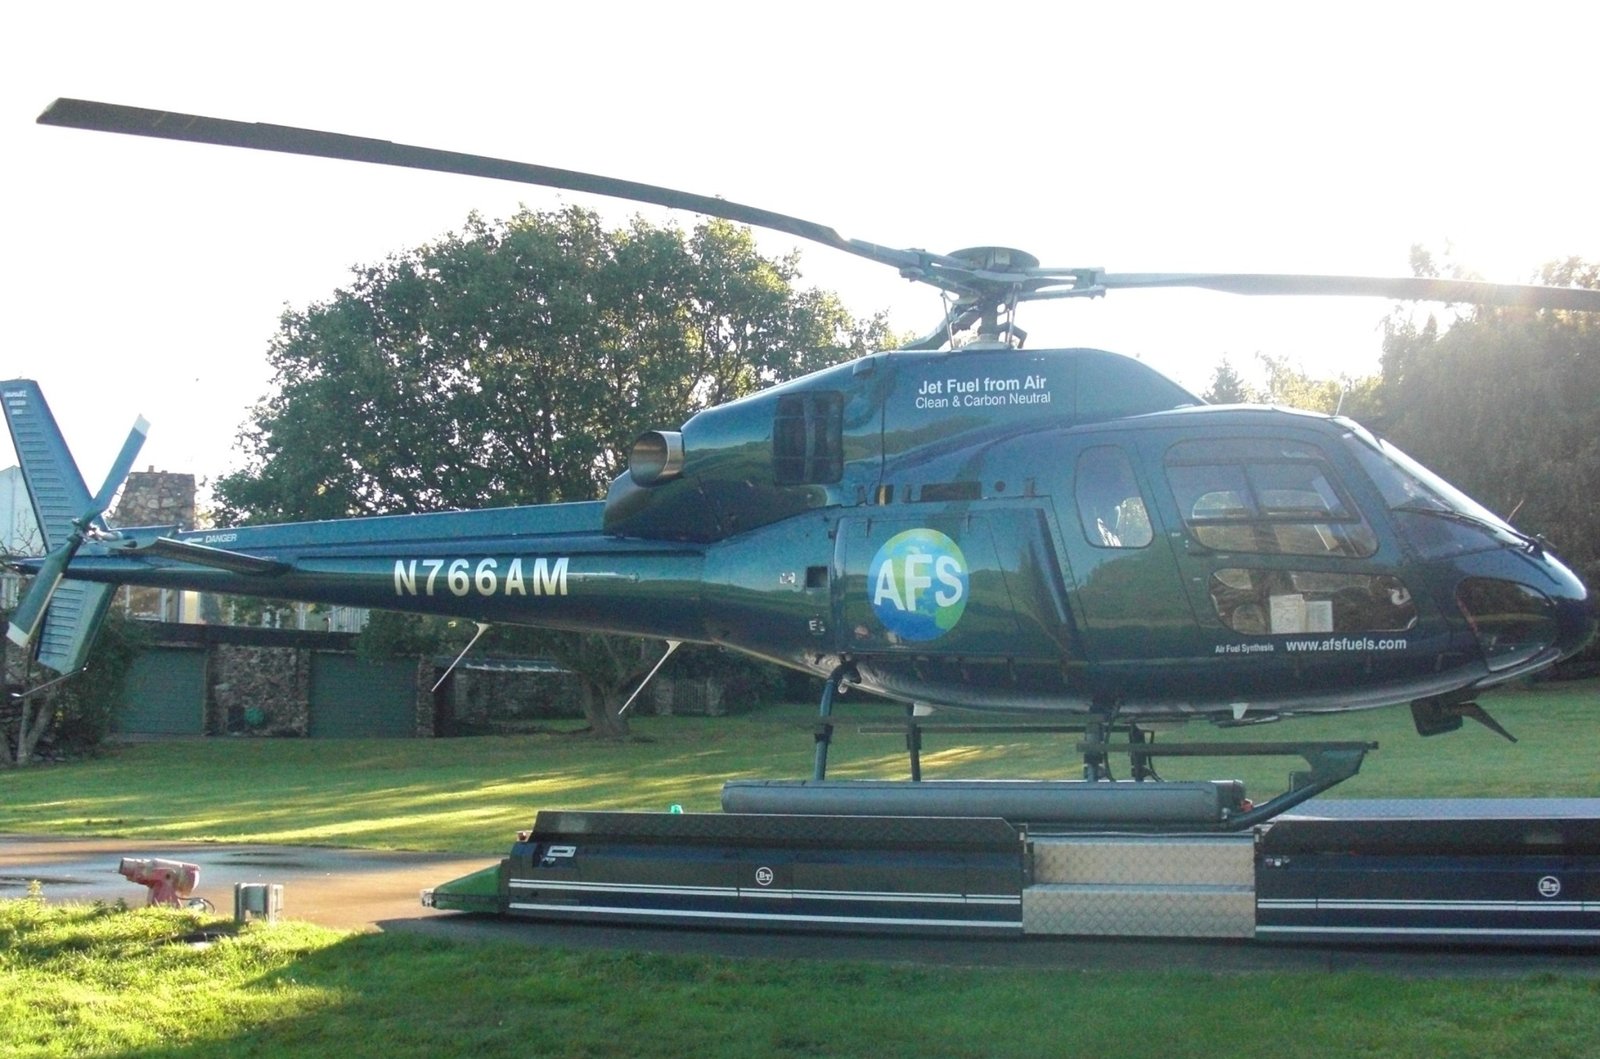
From the very beginning, one of our key motivations was to create fuel from air for helicopter operations — an ambitious and highly demanding challenge. Tony set out to meet that challenge head-on, and through his determination, belief, and perseverance, we have seen the first signs of real success.
The concept has now been proven, and the process has been demonstrated. Our task is to take this achievement forward and show the world an alternative pathway to a more sustainable future — producing aviation fuel, gasoline for cars, diesel for trucks, trains and ships, and fuel for heating applications.
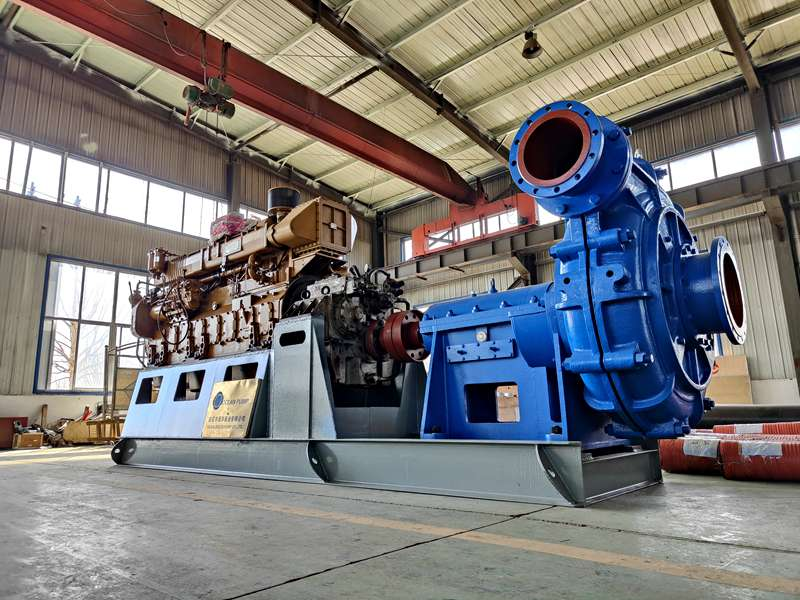
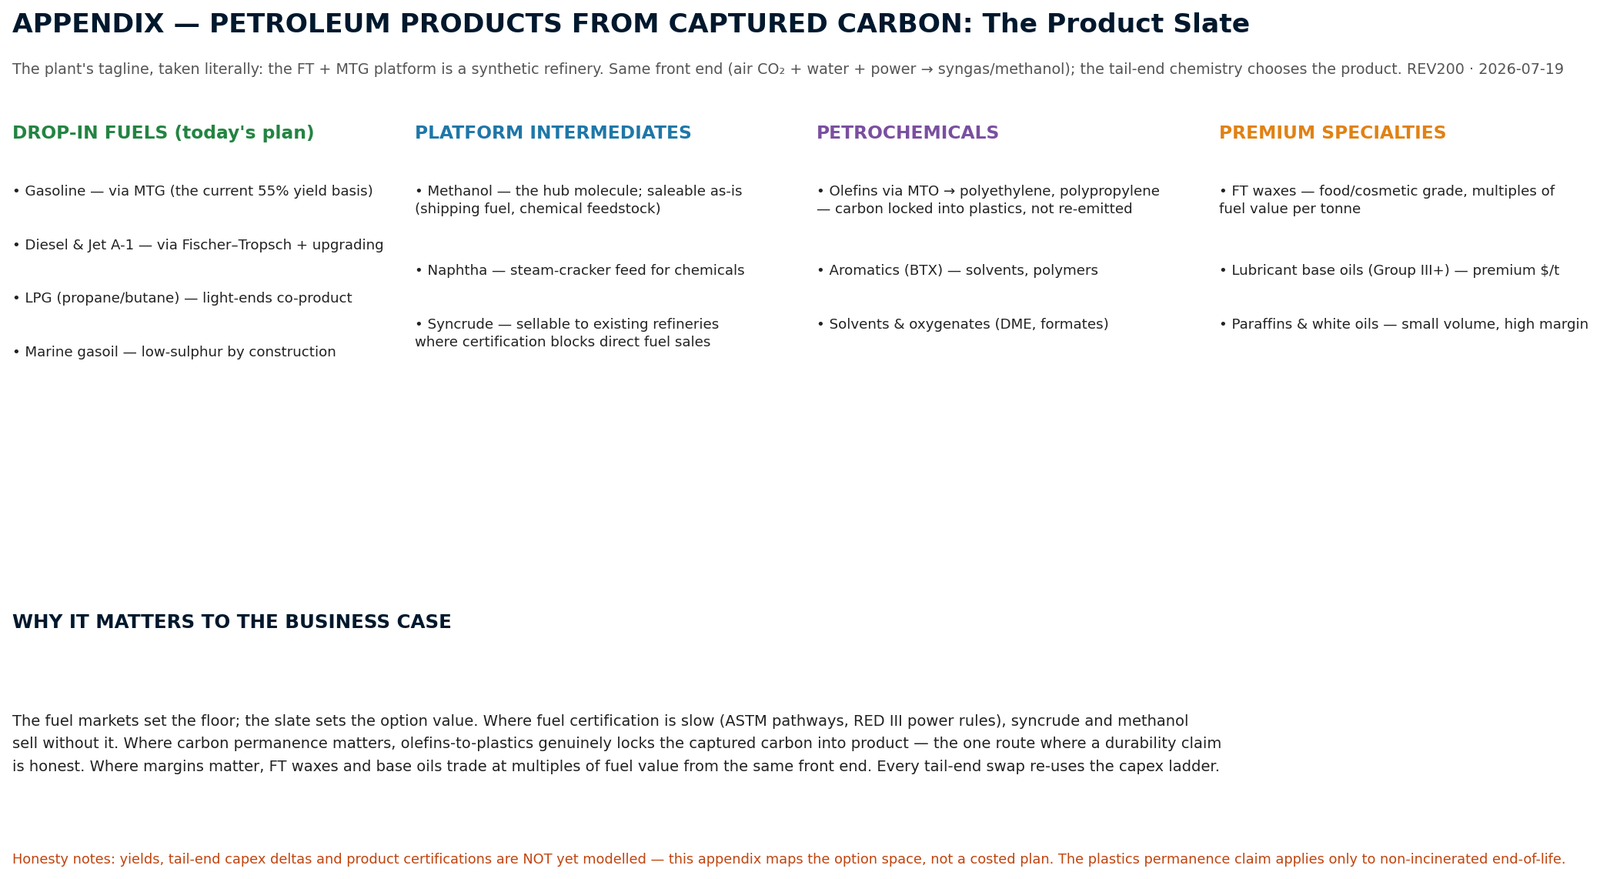
Synthetic man-made fuels can be used in industry not only as energy sources but also as feedstocks for making chemicals, lubricants, solvents, and other valuable products. Through established synthesis routes, synthetic fuels can be converted into hydrocarbons and chemical building blocks used in manufacturing plastics, detergents, adhesives, coatings, and synthetic rubber.
They are also important in producing high-quality lubricants, specialty waxes, solvents, and industrial fluids because synthetic fuel processes can create very pure and consistent chemical compounds. This makes them useful where performance, cleanliness, and reliability are required, such as in machinery, aviation, automotive applications, pharmaceuticals, paints, and electronics manufacturing. Overall, synthetic man-made fuels support industry by providing flexible raw materials that can reduce dependence on crude oil and help create cleaner, more controlled industrial products.
Fuel From Air converts renewable electricity into synthetic liquid fuel — diesel, gasoline or kerosene — drawn from air and water using renewable electricity. These calculators estimate the electricity cost per litre/gallon of fuel, and how much fuel can be produced per year from a given renewable energy supply, including the atmospheric CO₂ drawn in and the O₂ released.
Liquid fuel synthesised from captured CO₂ and renewable hydrogen is a drop-in replacement for diesel, petrol and kerosene — storable, transportable, and usable in the engines and infrastructure the world already runs on. It is most powerful where clean electricity is abundant but a grid connection is not, turning surplus renewable energy into fuel that can be stored indefinitely and moved anywhere.
Turn on-site wind and solar into diesel for tractors, harvesters and irrigation pumps. Farms become fuel-independent, producing their own carbon-neutral diesel from the air above their own land instead of trucking it in.
Islands pay a heavy premium to import fuel by ship. Local Fuel From Air plants powered by wind and solar replace that supply chain entirely — energy security from local air, water and renewable power, with no tanker dependence.
Cars, trucks, ships and aircraft are hard to electrify. Synthetic diesel, petrol and Jet A burn in existing engines with no modification, giving heavy transport and aviation a genuine path to carbon-neutral operation today.
Pair the synthesiser with on-site renewables to create machines that make their own fuel — closed-loop systems where captured carbon becomes fuel, the fuel does work, and the released CO₂ is captured again.
Surplus renewable power that would otherwise be curtailed is converted into liquid fuel — a high-density, long-duration store that holds energy for months, not hours, and dispatches it on demand.
Beyond fuel, the synthetic hydrocarbons serve as clean feedstock for chemicals, lubricants and solvents, and as process heat for industry — displacing fossil crude across the wider economy.
| Electricity Price | |
| Currency | |
| Volume Unit | |
Electricity requirement per unit is an indicative estimate. US gallon = 3.78541 L. Figures show the electricity component only — capital, CO₂ capture and operating costs are excluded. Technical background is available on request from info@fuelfromair.com.
Electricity from wind, solar, or your local power grid can be converted into synthetic liquid fuels — diesel, gasoline, or kerosene — by processing air and water using renewable electricity. These calculators estimate the electricity cost per litre/gallon of fuel and the annual fuel output when using local grid electricity as the conversion energy source, including the atmospheric CO₂ captured and the O₂ released. Ported from steveclamp.com.
← Back to Fuel Production| Location | |
| Site Wind Speed | |
| Turbine Purchase Price | |
| Currency | |
| Volume Unit | |
| Consumer Price (kWh) value of wind power/yr | $ |
| Wind Contractor Price (kWh) power-company contract income | $ |
| Capital Payback (yrs) | |
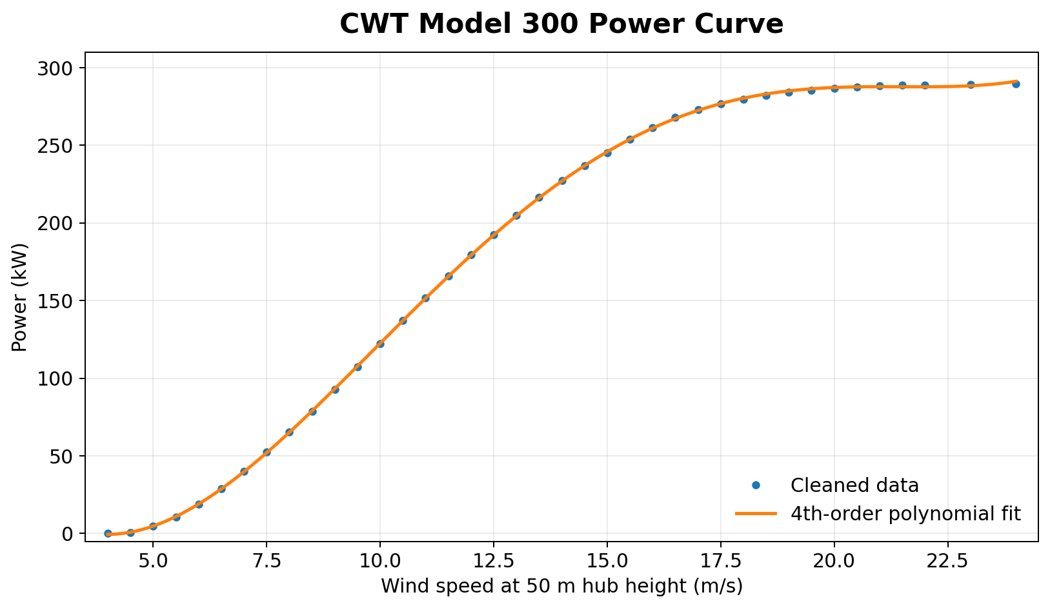

Annual energy is estimated from the turbine’s performance and the site’s wind resource. Fuel volumes, carbon figures and costs are indicative planning estimates; the carbon is re-emitted on combustion, so the cycle is carbon-neutral. Costs spread the turbine capital over the payback period and include an allowance for maintenance. Indicative engineering estimate only. Technical background is available on request from info@fuelfromair.com.
Electricity from wind, solar, or your local power grid can be converted into synthetic liquid fuels — diesel, gasoline, or kerosene — by processing air and water using renewable electricity. These calculators estimate the electricity cost per litre/gallon of fuel and the annual fuel output when using local grid electricity as the conversion energy source, including the atmospheric CO₂ captured and the O₂ released. Ported from steveclamp.com.
← Back to Fuel Production| Location | |
| Consumer Price | $ per kWh |
| Contractor Price | $ per kWh |
| Currency | |
| Volume Unit | |
Uses each location’s modelled annual energy availability, costed at the consumer electricity price per kWh shown above (pre-filled from local tariffs, editable). Fuel volumes are indicative planning estimates. Figures are indicative only. Technical background is available on request from info@fuelfromair.com.
Fuel Demand Calculator. Select a location, a product and a demand case to size the plant required and see the production economics. All results are shown in both litres and US gallons. The electricity price basis is user-selectable: the database's retail proxies, a negotiated power-purchase agreement (PPA), or your own figure.
| Location | |
| Product | |
| Demand case | |
| Custom volume | |
| Electricity price basis | |
| Tariff ($/kWh) | |
| Display units |
User Location Analysis. Pick any of the 434 sites and see the whole analysis for it on one page — production cost, margin and verdict for all three fuels, the carbon balance, and the plant required. Every figure in both litres and US gallons.
| Country | |
| Location | |
| Plant size | |
| Energy source | |
| Electricity basis | |
| Tariff ($/kWh) | |
| Units | |
| Export |
Opens a print view of this location, formatted for A4.
|
What each location spends on fuel today, what FFA would cost instead, and the scale of plant required to serve a meaningful share of national demand.
Select an aspect to review:
Analysis
Charts by topic
The five charts that carry the argument. Every figure is given in both litres and US gallons. Full detail on the tabs above.
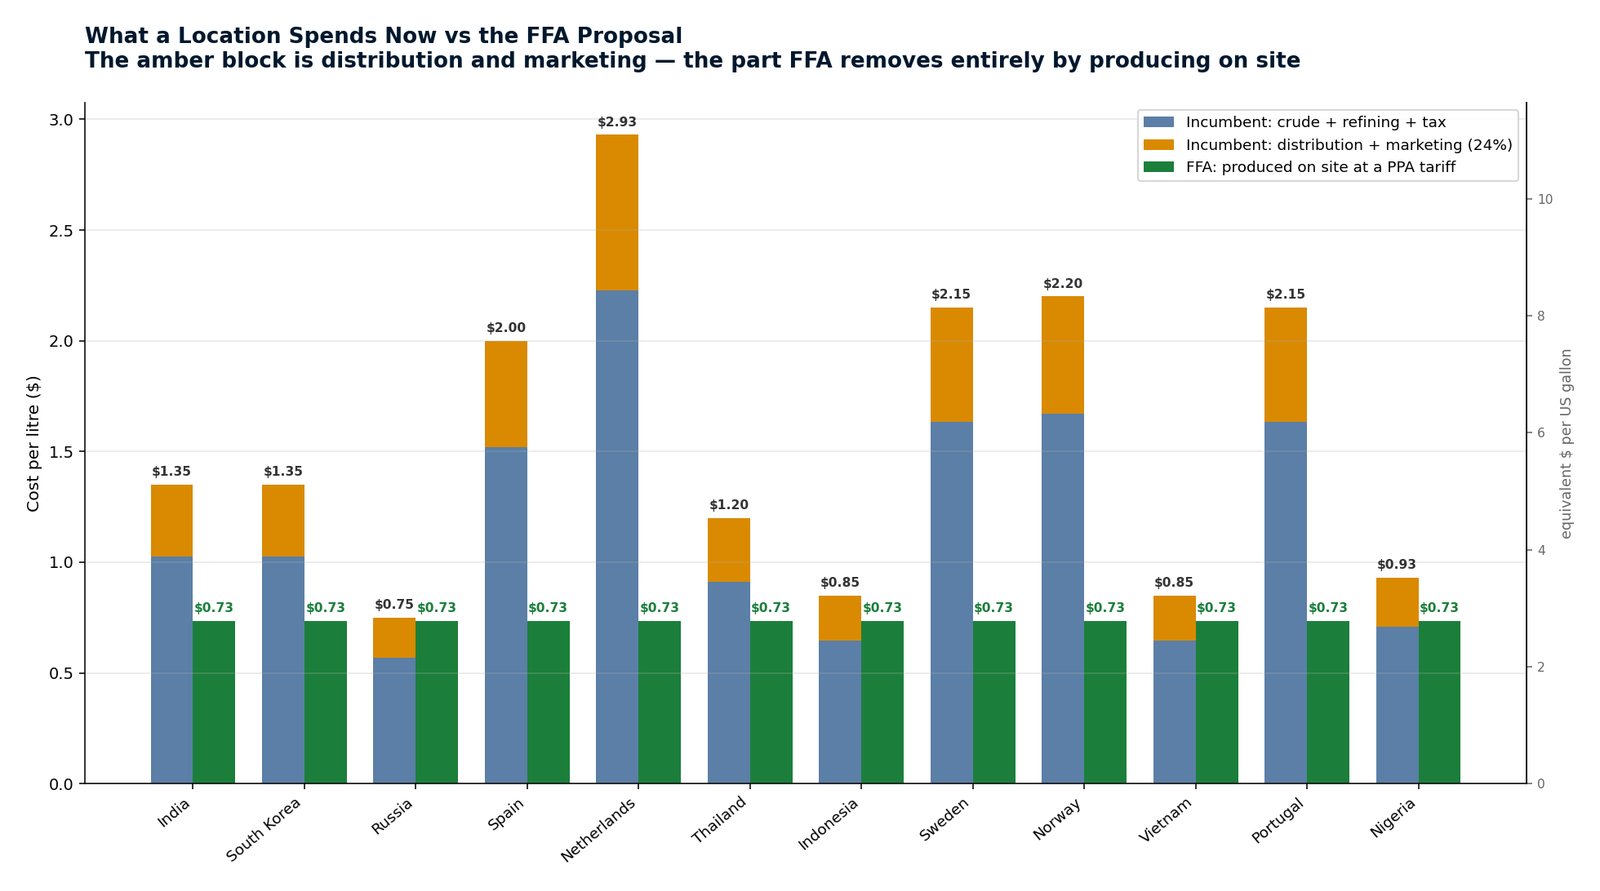
What a location spends now, and what FFA would cost instead. The amber block is distribution and marketing \u2014 the layer FFA removes by producing on site.
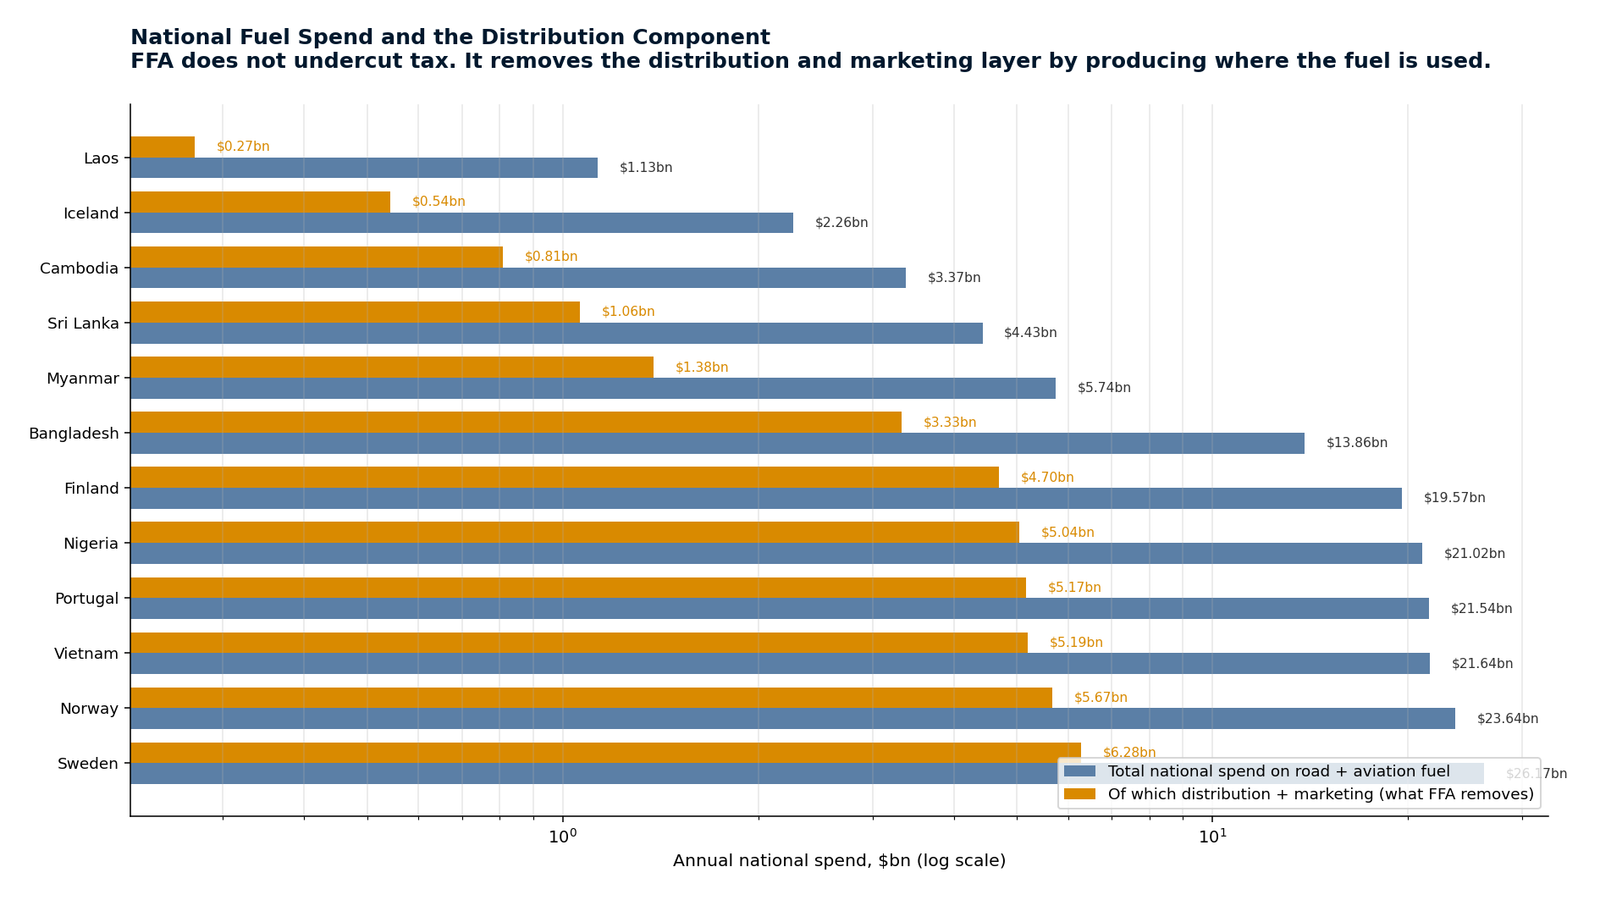
Total national spend on road and aviation fuel, and the share of it that is distribution rather than product.
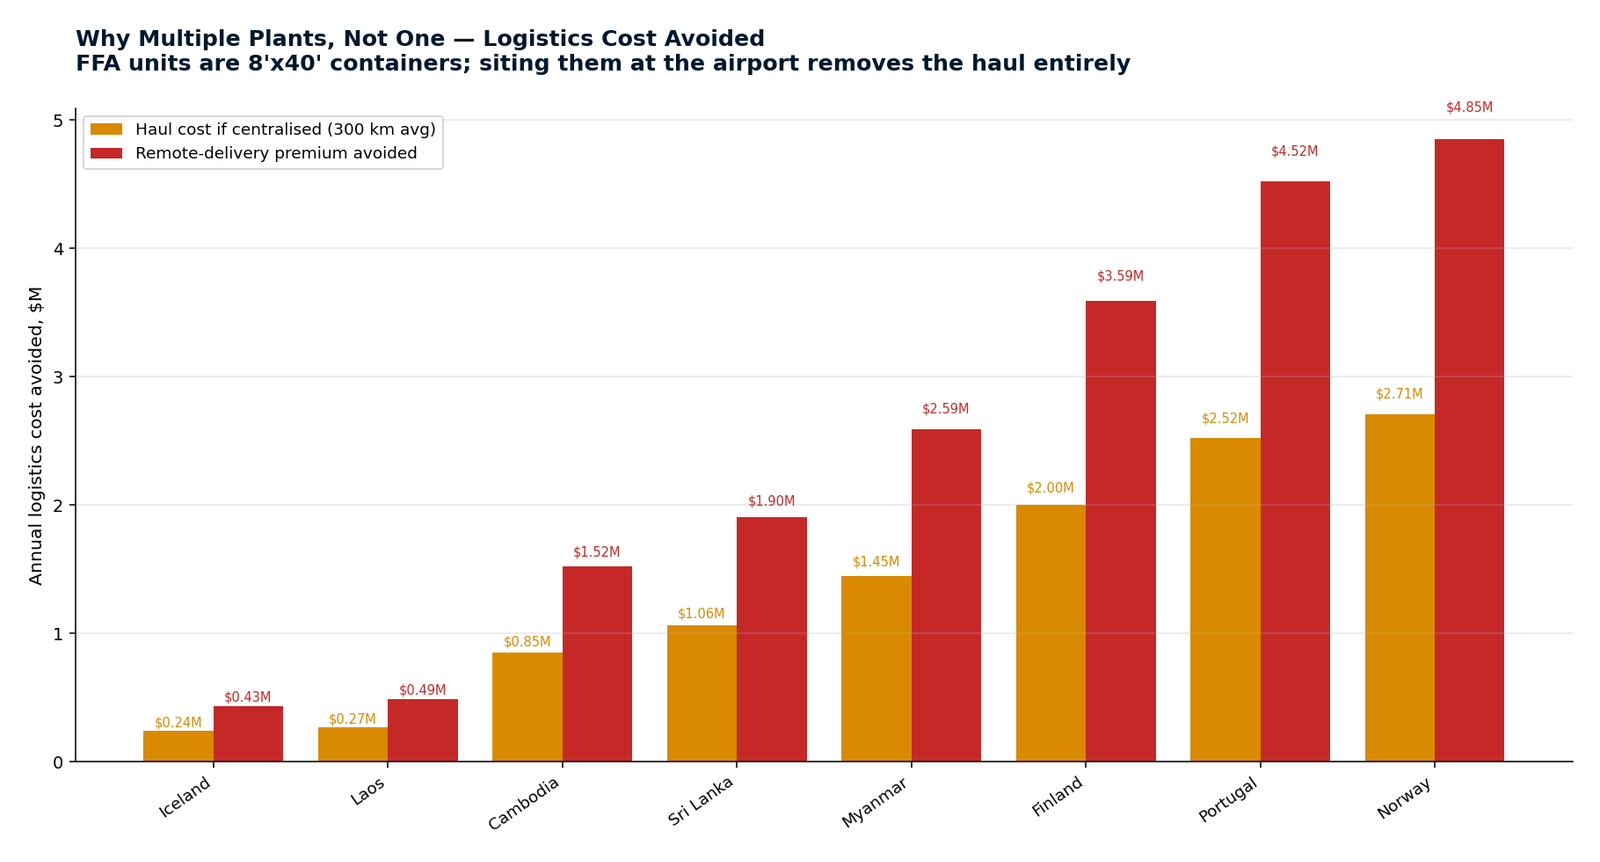
FFA's units are shipping containers. Siting them where the fuel is used does not reduce the haul \u2014 it designs it out.
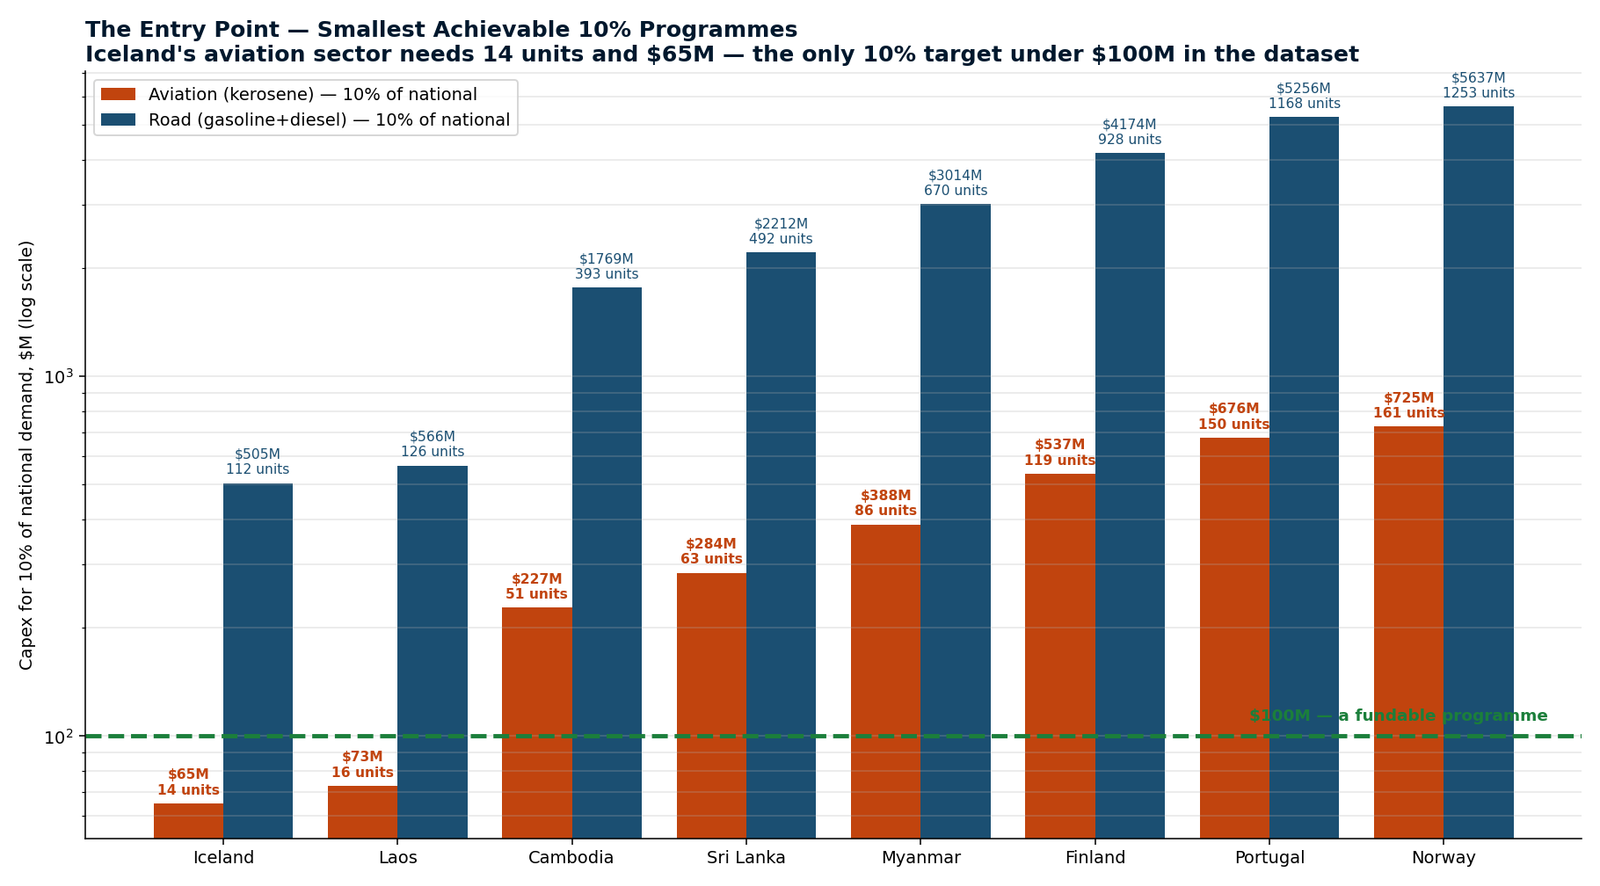
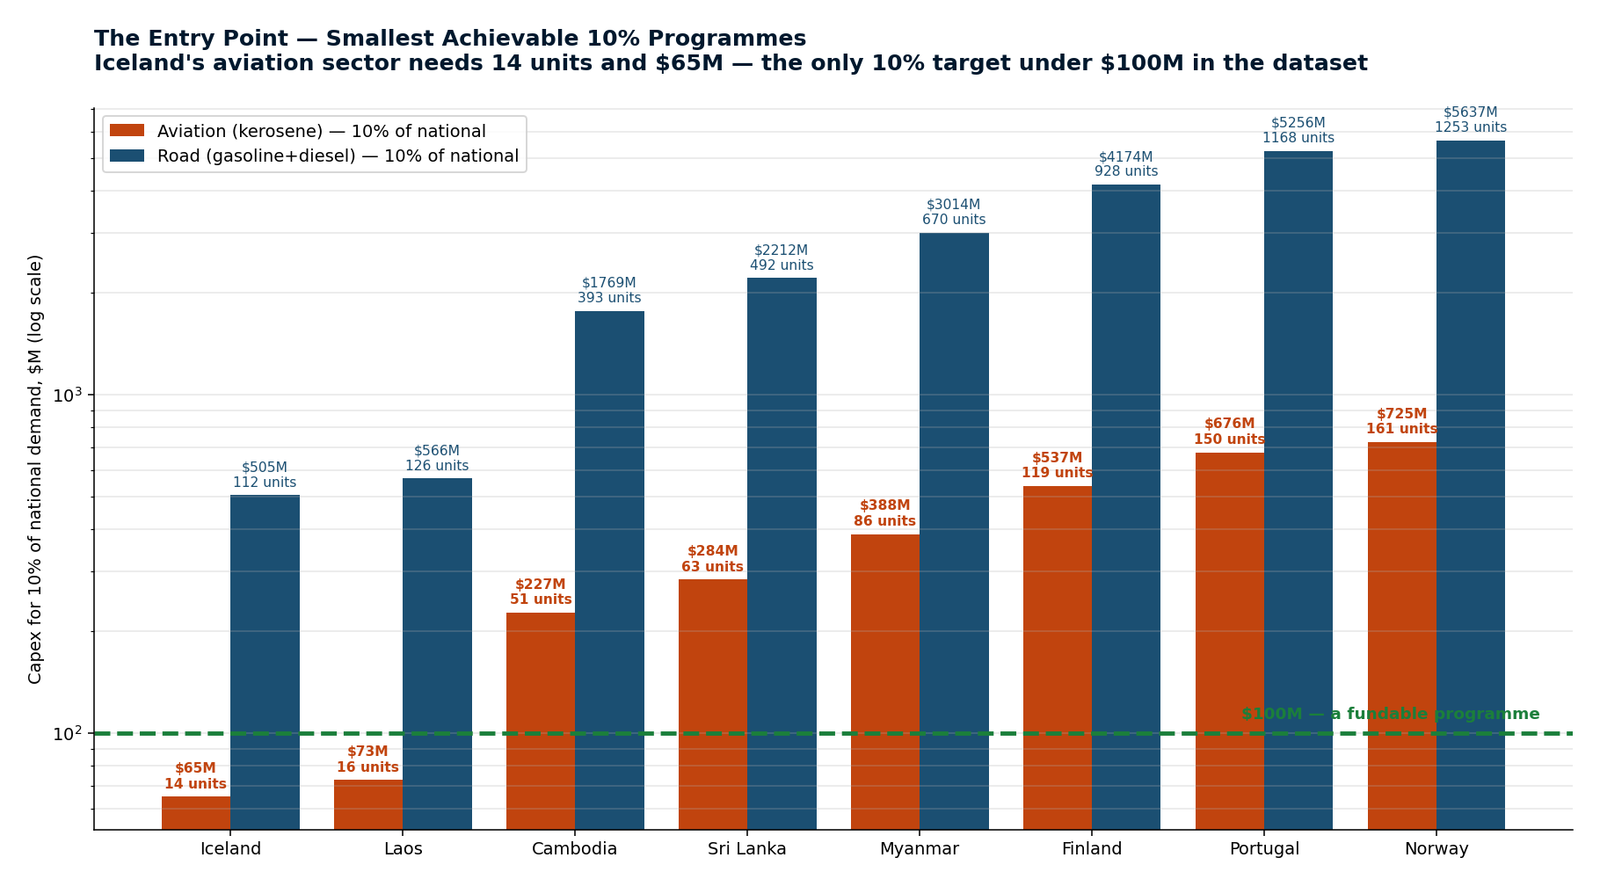
The smallest achievable programmes. Iceland's aviation sector is the only ten-percent target under $100M in the database.
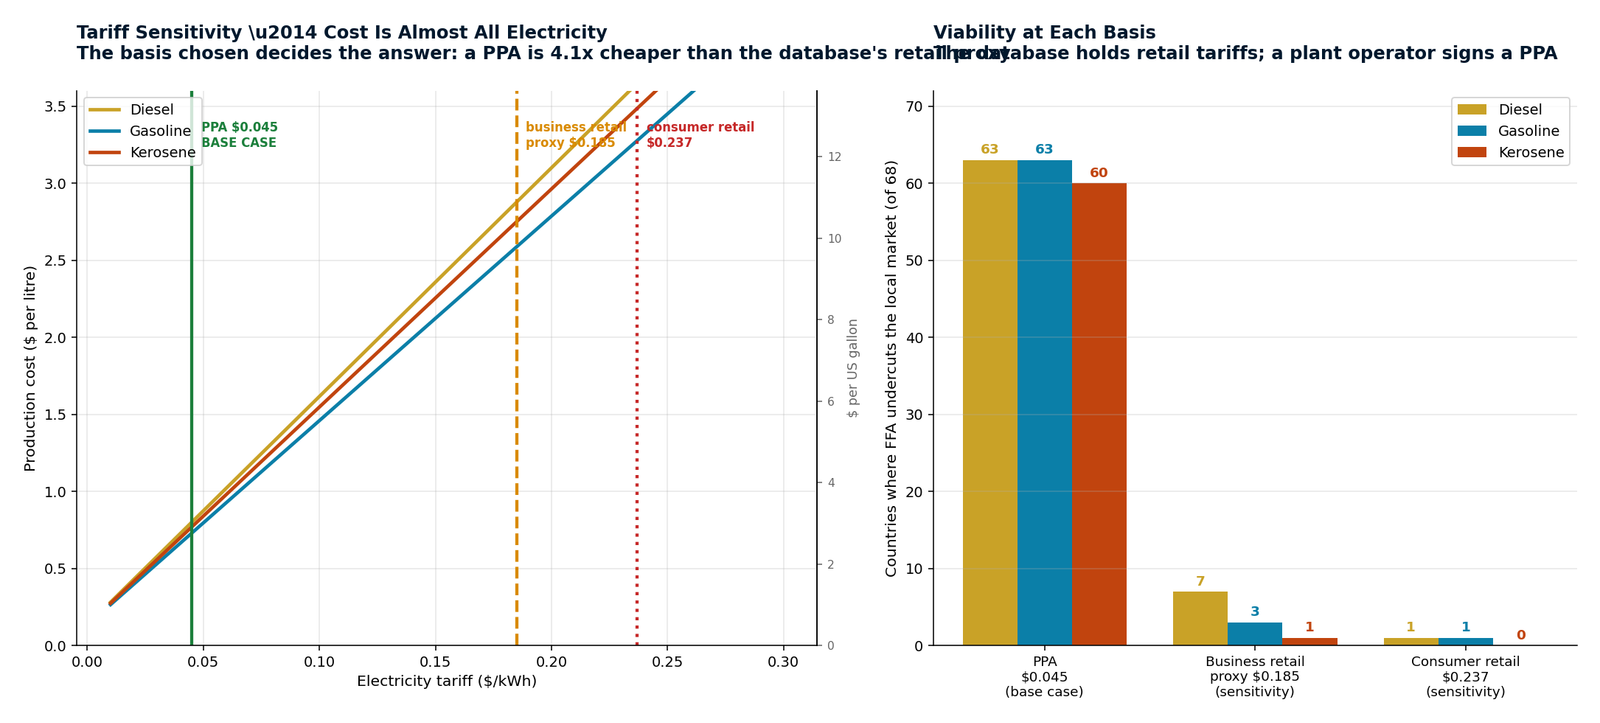
The database carries retail tariffs. A plant operator signs a power-purchase agreement \u2014 far cheaper than retail.
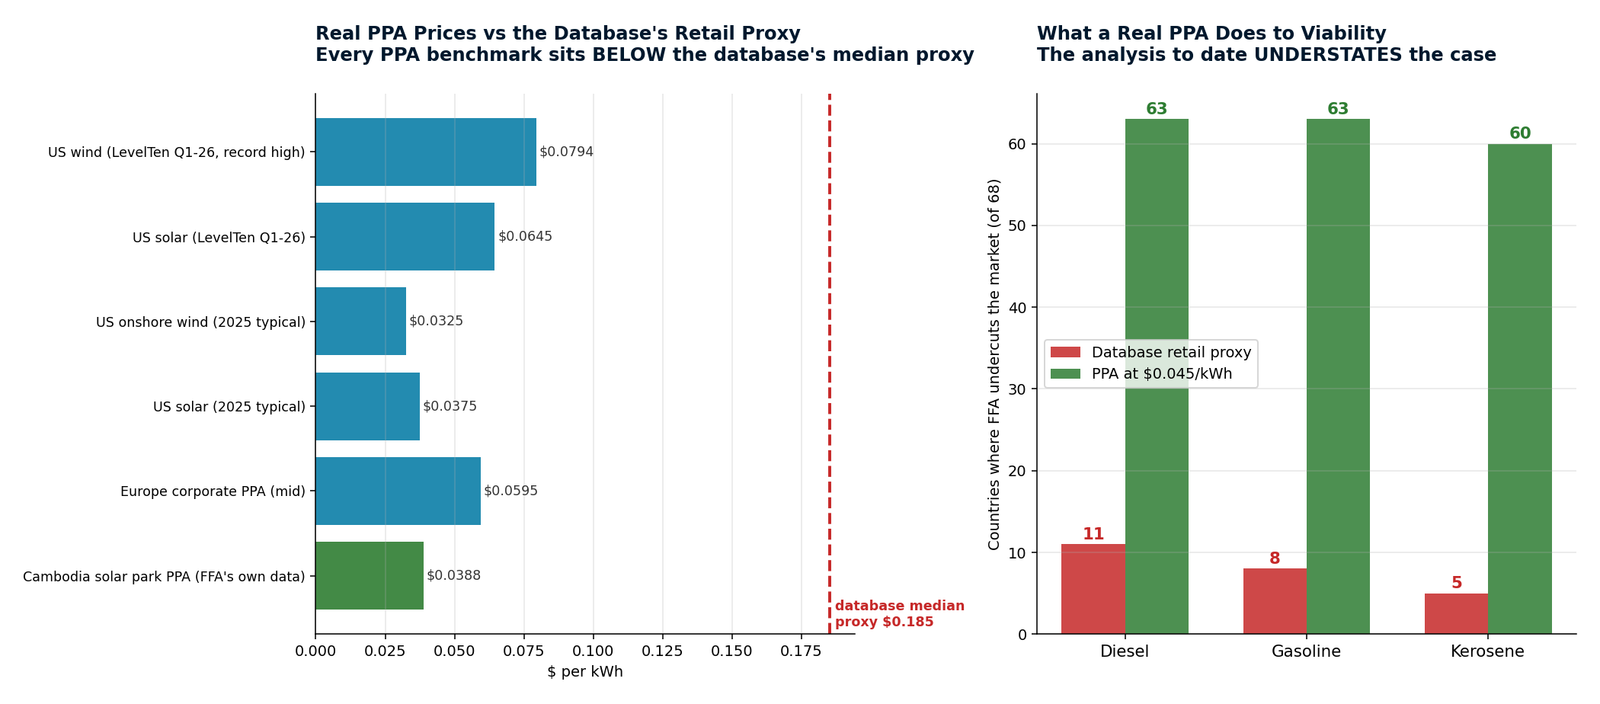
A pump price contains crude, refining, distribution, tax and retail margin. FFA's figure is a factory-gate production cost. Presenting the difference as a national saving would be a false comparison, and this analysis does not make that claim.
Two comparisons are defensible. First, whether FFA can produce below the price at which fuel currently sells — that determines whether there is a business. Second, the distribution and marketing layer, a substantial part of the pump price. FFA removes that layer structurally, because the fuel is made where it is used rather than shipped to it.
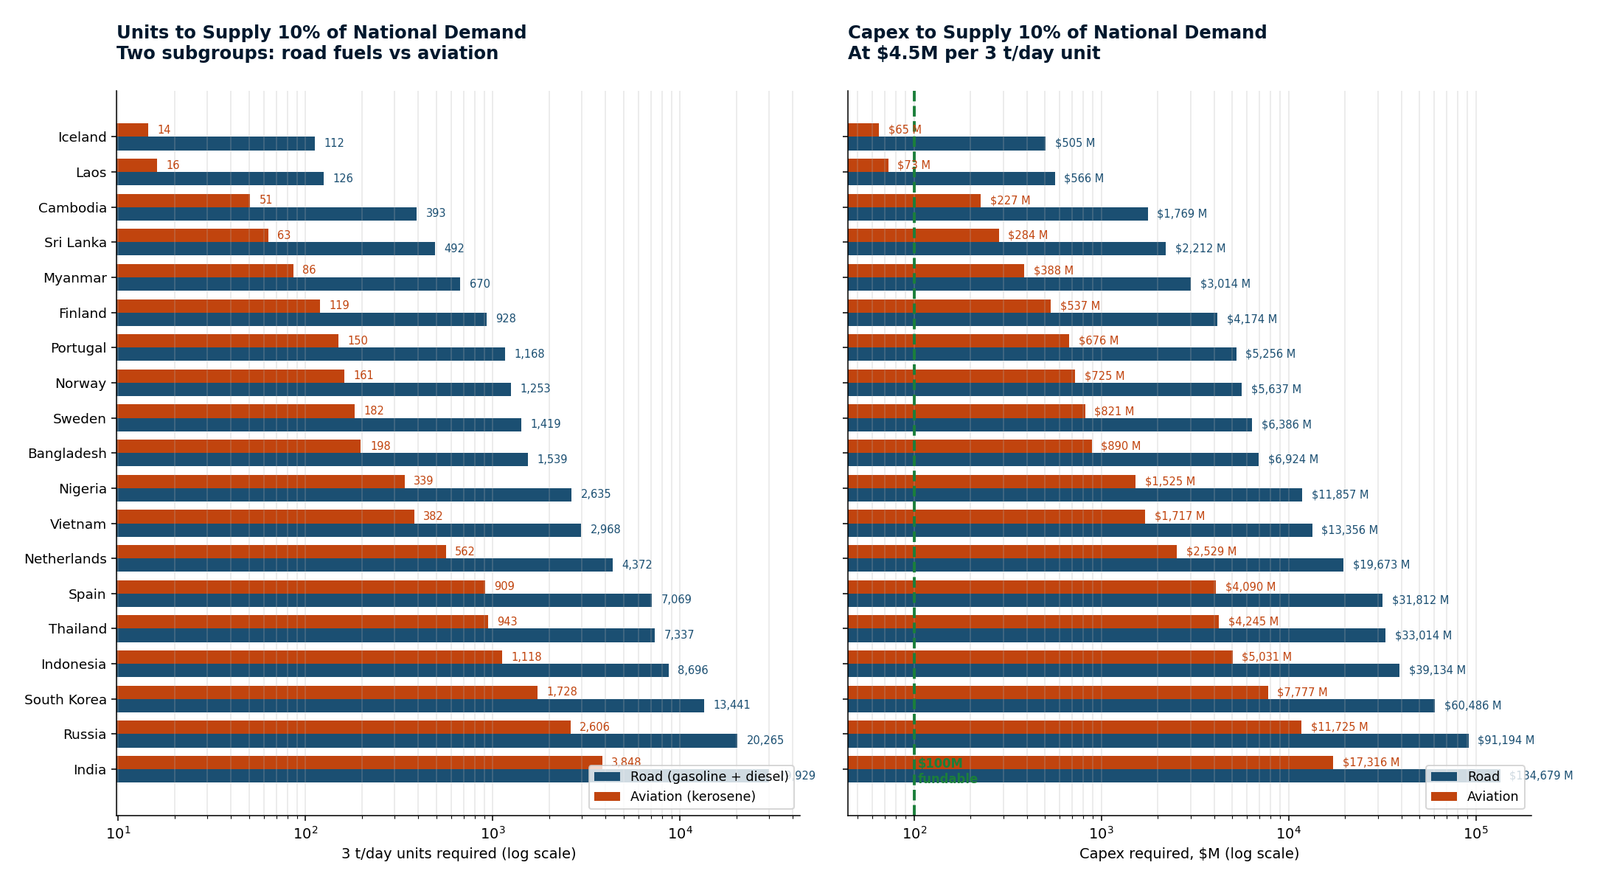
Iceland's aviation sector is the clearest entry point in the dataset: around fourteen base units — or one plant scaled to the same output — for $55–65M of capital and 26 MW of power, in a country whose electricity is cheap, whose fuel is not subsidised, and where all three products are already viable. It is the only ten-percent target anywhere in the database costing under $100M.
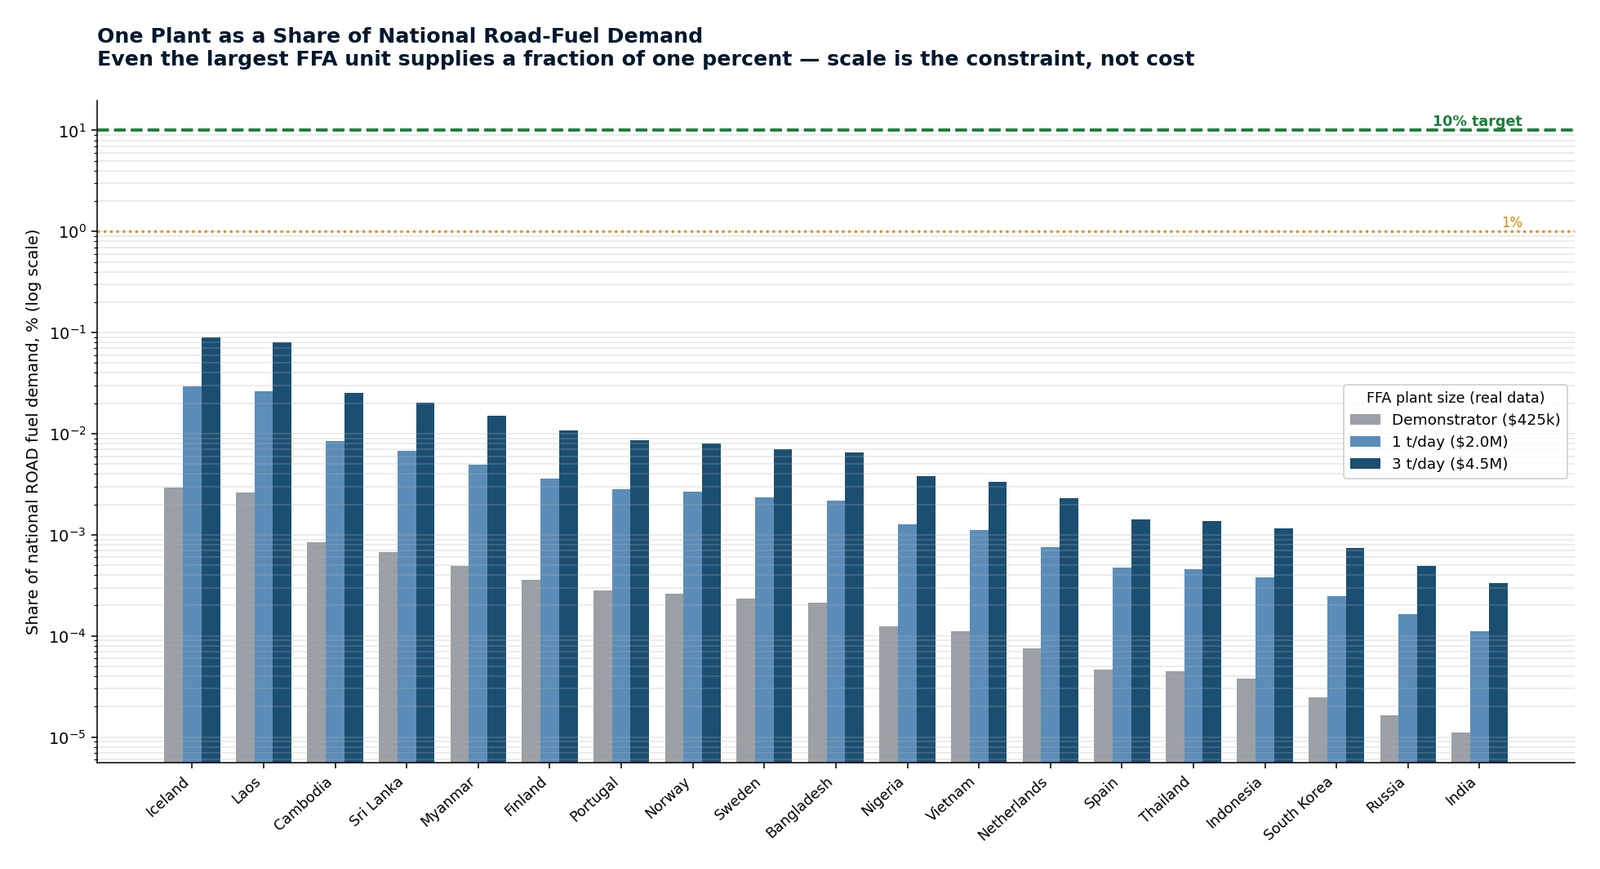
The counterweight is scale. Even FFA's largest standard unit supplies under a hundredth of a percent of a mid-sized country's road fuel. India at ten percent would need nearly thirty thousand base units and $135bn. FFA cannot address large markets at a ten-percent share, and the plan does not claim it can. The strategy is small markets, or well-chosen niches inside large ones.
The 394-location database carries retail tariffs — the business column is labelled a proxy in FFA's own workbook. A plant operator signs a power-purchase agreement instead. Real corporate PPAs are far below retail, and FFA's own workbook already records the Cambodia National Solar Park. The figures throughout this section use a representative PPA; the basis is available on request. On the database's retail proxies the same analysis would understate FFA's position several-fold.
| Country | Pump $/L | Pump $/gal | Distribution $/L | Distribution $/gal | FFA $/L | FFA $/gal | FFA margin | National spend | Distribution spend |
|---|---|---|---|---|---|---|---|---|---|
| India | $1.35 | $5.11 | $0.32 | $1.23 | $0.73 | $2.76 | 46% | $346.5bn | $83.2bn |
| South Korea | $1.35 | $5.11 | $0.32 | $1.23 | $0.73 | $2.76 | 46% | $155.6bn | $37.3bn |
| Russia | $0.75 | $2.84 | $0.18 | $0.68 | $0.73 | $2.76 | 3% | $130.4bn | $31.3bn |
| Spain | $2.00 | $7.57 | $0.48 | $1.82 | $0.73 | $2.76 | 64% | $121.3bn | $29.1bn |
| Netherlands | $2.93 | $11.09 | $0.70 | $2.66 | $0.73 | $2.76 | 75% | $109.9bn | $26.4bn |
| Thailand | $1.20 | $4.54 | $0.29 | $1.09 | $0.73 | $2.76 | 39% | $75.5bn | $18.1bn |
| Indonesia | $0.85 | $3.22 | $0.20 | $0.77 | $0.73 | $2.76 | 14% | $63.4bn | $15.2bn |
| Sweden | $2.15 | $8.14 | $0.52 | $1.95 | $0.73 | $2.76 | 66% | $26.2bn | $6.3bn |
| Norway | $2.20 | $8.33 | $0.53 | $2.00 | $0.73 | $2.76 | 67% | $23.6bn | $5.7bn |
| Vietnam | $0.85 | $3.22 | $0.20 | $0.77 | $0.73 | $2.76 | 14% | $21.6bn | $5.2bn |
| Portugal | $2.15 | $8.14 | $0.52 | $1.95 | $0.73 | $2.76 | 66% | $21.5bn | $5.2bn |
| Nigeria | $0.93 | $3.52 | $0.22 | $0.84 | $0.73 | $2.76 | 22% | $21.0bn | $5.0bn |
Screening figures for gasoline; assumptions and sources are available on request. Road and aviation fuel only.
| Country | Road demand (gal/yr) | Road (L/yr) | Aviation (gal/yr) | Aviation (L/yr) | 10% road: units | 10% road: capex | 10% aviation: units | 10% aviation: capex |
|---|---|---|---|---|---|---|---|---|
| Iceland | 225,265,152 | 852,720,959 | 28,962,662 | 109,635,552 | 112 | $505M | 14 | $65M |
| Laos | 252,360,927 | 955,289,577 | 32,446,405 | 122,822,946 | 126 | $566M | 16 | $73M |
| Cambodia | 789,082,623 | 2,987,001,252 | 101,453,480 | 384,043,018 | 393 | $1769M | 51 | $227M |
| Sri Lanka | 986,844,222 | 3,735,609,986 | 126,879,971 | 480,292,713 | 492 | $2212M | 63 | $284M |
| Myanmar | 1,344,755,265 | 5,090,450,028 | 172,897,106 | 654,486,432 | 670 | $3014M | 86 | $388M |
| Finland | 1,862,032,389 | 7,048,556,026 | 239,404,164 | 906,242,918 | 928 | $4174M | 119 | $537M |
| Portugal | 2,344,895,196 | 8,876,389,724 | 301,486,525 | 1,141,250,107 | 1168 | $5256M | 150 | $676M |
| Norway | 2,514,895,698 | 9,519,911,324 | 323,343,733 | 1,223,988,599 | 1253 | $5637M | 161 | $725M |
| Sweden | 2,848,876,611 | 10,784,166,012 | 366,284,136 | 1,386,535,630 | 1419 | $6386M | 182 | $821M |
| Bangladesh | 3,089,014,929 | 11,693,188,002 | 397,159,062 | 1,503,409,886 | 1539 | $6924M | 198 | $890M |
Unit counts use FFA's base 3 t/day plant. Sources, figures and assumptions are available on request.
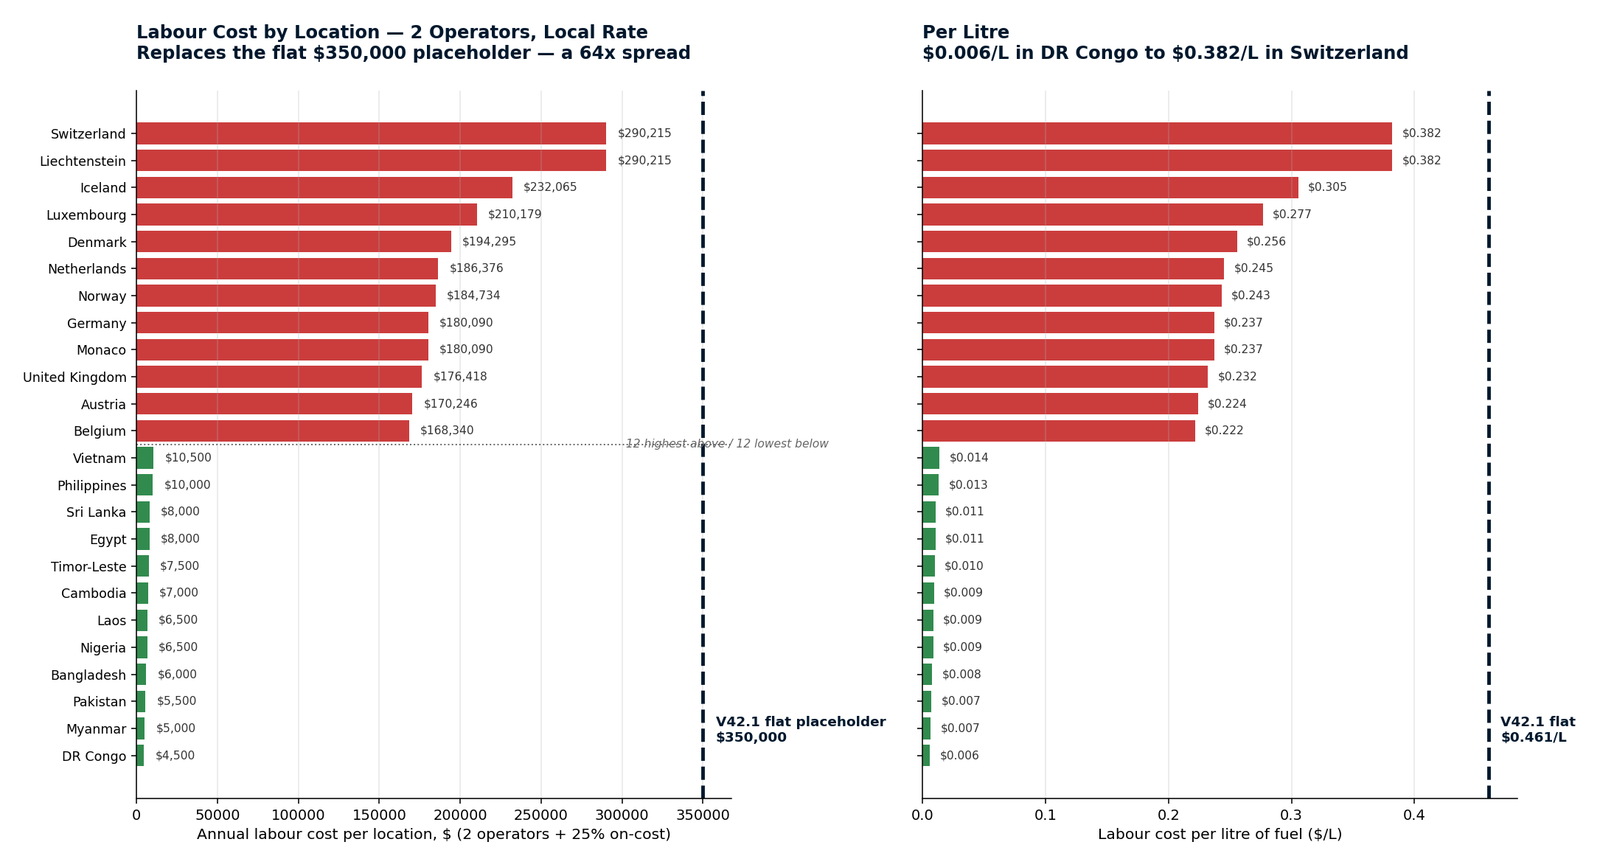
Two operators per location regardless of output, at the local average wage plus 25% employer on-cost. Sources: OECD Taxing Wages 2026 (Europe), ILO and national statistics elsewhere. A 64× spread — $4,500/yr in DR Congo to $290,215 in Switzerland. This replaces the local rate: 2 operators x local wage x 1.25 placeholder in FFA's V42.1 model, which was 2.4× too high for Switzerland and 50× too high for Myanmar.
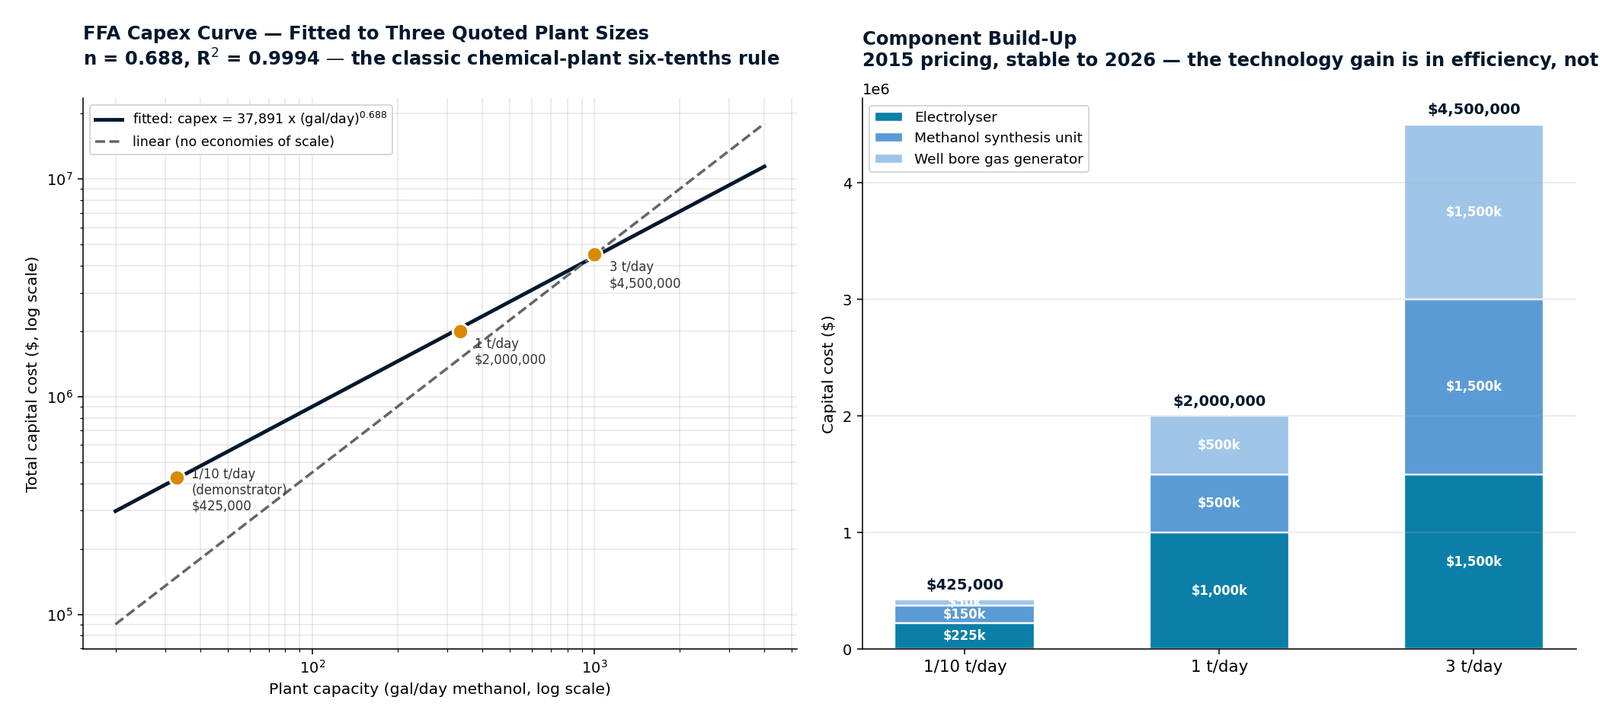
FFA's three quoted plant sizes, fitted to a smooth scaling curve that follows the pattern seen in real process plants. 2015 pricing, stable to 2026: the technology gain has come through efficiency, not cost.
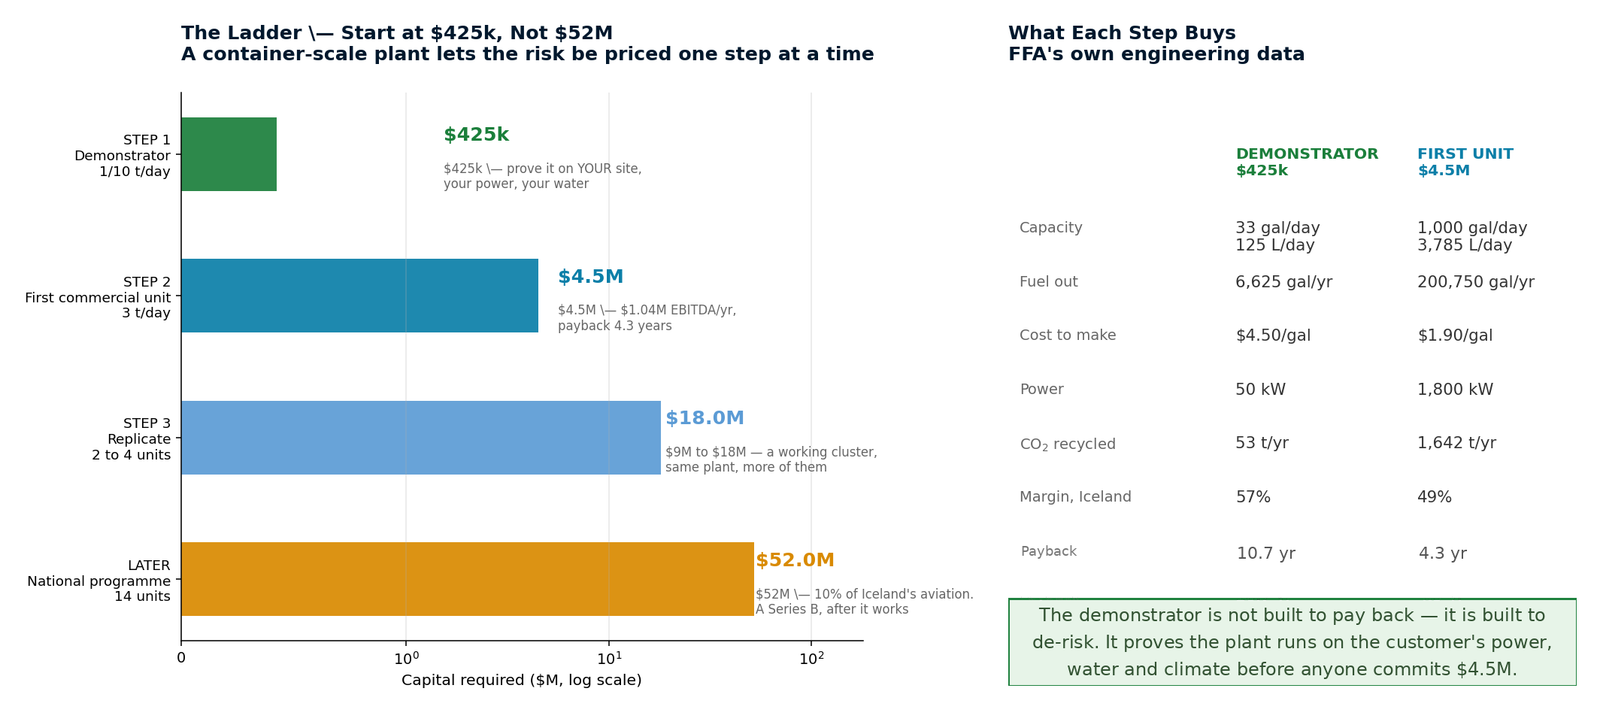
The pilot proved the process; the design is scalable. This analysis assumes output rises linearly with plant size, while production cost falls with scale to a cap. The cap is reached at a few times the base unit and holds thereafter — which agrees with FFA's own note that there are minimal economies of scale beyond 3 t/day, once the electrolyser is at its limit.
For reference, FFA's measured data shows a far steeper curve at small sizes: $4.50/gal at 33 gal/day, $2.40 at 333, $1.90 at 1,000 — reductions of 47% then 21%. The 8% rule applies beyond the 3 t/day base, where the step changes are smaller.
| Size | Plant output gal/day | Finished fuel gal/yr | Finished fuel L/yr | Cost cut | $/gal | $/L | Capex |
|---|---|---|---|---|---|---|---|
| 1x | 1,000 | 200,750 | 759,921 | -0% | $1.900 | $0.50 | $4,500,000 |
| 2x | 2,000 | 401,500 | 1,519,842 | -8% | $1.748 | $0.46 | $8,280,000 |
| 4x | 4,000 | 803,000 | 3,039,684 | -15% | $1.615 | $0.43 | $15,300,000 |
| 8x | 8,000 | 1,606,000 | 6,079,368 | -15% | $1.615 | $0.43 | $30,600,000 |
| 16x | 16,000 | 3,212,000 | 12,158,737 | -15% | $1.615 | $0.43 | $61,200,000 |
| 32x | 32,000 | 6,424,000 | 24,317,474 | -15% | $1.615 | $0.43 | $122,400,000 |
| 64x | 64,000 | 12,848,000 | 48,634,948 | -15% | $1.615 | $0.43 | $244,800,000 |
| 128x | 128,000 | 25,696,000 | 97,269,895 | -15% | $1.615 | $0.43 | $489,600,000 |
| Country | 10% aviation (gal/yr) | Base units | Capex, base units | Scaled plant size | Capex, scaled | Capex avoided |
|---|---|---|---|---|---|---|
| Iceland | 2,896,266 | 14 | $64.9M | 14x | $55.2M | $9.7M |
| Laos | 3,244,640 | 16 | $72.7M | 16x | $61.8M | $10.9M |
| Cambodia | 10,145,348 | 51 | $227.4M | 51x | $193.3M | $34.1M |
| Sri Lanka | 12,687,997 | 63 | $284.4M | 63x | $241.8M | $42.7M |
| Myanmar | 17,289,711 | 86 | $387.6M | 86x | $329.4M | $58.1M |
| Finland | 23,940,416 | 119 | $536.6M | 119x | $456.1M | $80.5M |
| Portugal | 30,148,653 | 150 | $675.8M | 150x | $574.4M | $101.4M |
| Norway | 32,334,373 | 161 | $724.8M | 161x | $616.1M | $108.7M |
| Sweden | 36,628,414 | 182 | $821.1M | 182x | $697.9M | $123.2M |
| Bangladesh | 39,715,906 | 198 | $890.3M | 198x | $756.7M | $133.5M |
Scaling rule available on request. Base is FFA's real 3 t/day unit.
FFA's base units are 8′×40′ shipping containers — the company's own specification. At these volumes there is no single-plant option in the conventional sense: supplying a tenth of a country's aviation fuel takes between fourteen and a hundred and nineteen base units. Because each goes to the demand point, the road haul and the remote-delivery premium are not reduced but designed out.
The tension worth naming: the scaling rule rewards building one large plant, while the logistics argument rewards dispersing many small ones. Both are true, and they pull in opposite directions. The resolution depends on how concentrated the demand is: a single airport justifies one scaled plant on site; a national road network does not.
| Country | 10% aviation (gal/yr) | 10% aviation (L/yr) | Base units | Capex | Haul cost if centralised | Remote premium avoided |
|---|---|---|---|---|---|---|
| Iceland | 2,896,266 | 10,963,555 | 14 | $64.9M | $242,417 | $434,440 |
| Laos | 3,244,640 | 12,282,295 | 16 | $72.7M | $271,576 | $486,696 |
| Cambodia | 10,145,348 | 38,404,302 | 51 | $227.4M | $849,166 | $1,521,802 |
| Sri Lanka | 12,687,997 | 48,029,271 | 63 | $284.4M | $1,061,985 | $1,903,200 |
| Myanmar | 17,289,711 | 65,448,643 | 86 | $387.6M | $1,447,149 | $2,593,457 |
| Finland | 23,940,416 | 90,624,292 | 119 | $536.6M | $2,003,813 | $3,591,062 |
| Portugal | 30,148,653 | 114,125,011 | 150 | $675.8M | $2,523,442 | $4,522,298 |
| Norway | 32,334,373 | 122,398,860 | 161 | $724.8M | $2,706,387 | $4,850,156 |
Caveat: the logistics avoided ($0.2–3.6M a year) is small against the capital required ($55–537M). Distribution economics support the siting decision; they do not by themselves justify the investment.
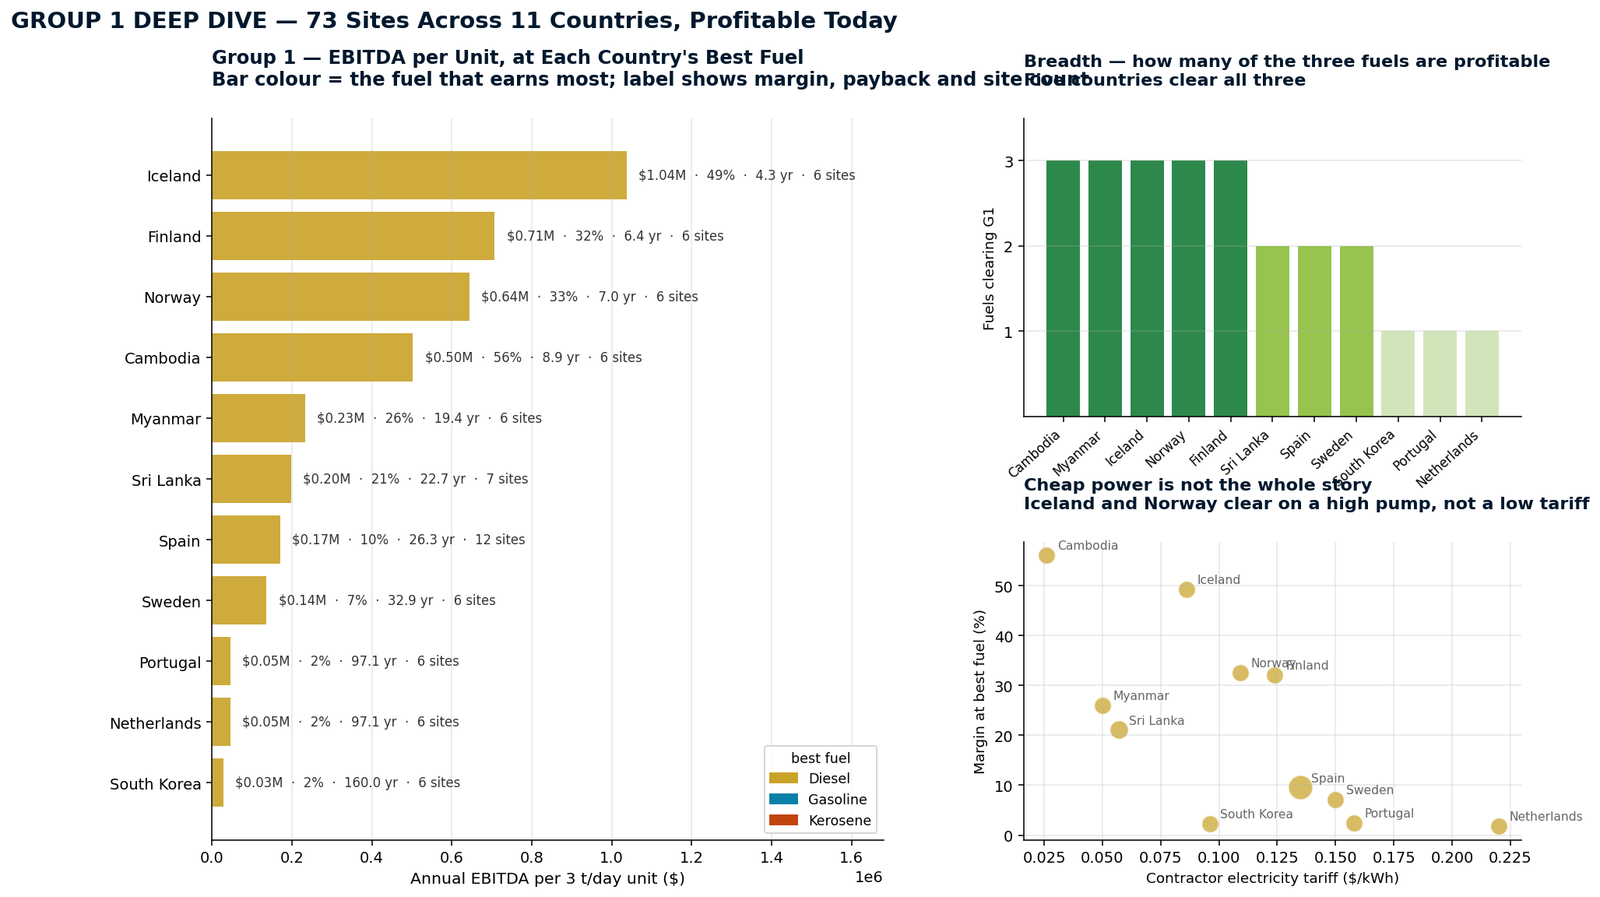
Ranked by payback on a base 3 t/day unit at the site's best product. Ranking by margin alone would be misleading: Cambodia has the highest margin (56%) but pays back in 8.9 years, while Iceland's lower 49% margin pays back in 4.3, because Iceland clears on a high pump price rather than a low tariff.
Aviation fuel is assumed to be produced at the main or regional airport in each country. All figures in both litres and US gallons.
The business plan assumptions and sources for this site are available on request.
| Measure | Value | Notes |
|---|---|---|
| Best product | Diesel | |
| Production cost | $1.41/L | $5.33/gal |
| Local market price | $2.77/L | $10.50/gal |
| Margin | 49% | |
| EBITDA per base unit | $1,037,382/yr | |
| Payback on a base unit | 4.3 years | |
| Products clearing the local price | Diesel, Gasoline, Kerosene | of three |
| Measure | Value | Notes |
|---|---|---|
| Airport | Keflavík International (KEF) | Iceland's sole international hub, 50 km from Reykjavík; Air BP and SUAT supply Jet A-1 there today. |
| National jet fuel | 28,962,662 gal/yr | 109,635,552 L/yr |
| Uplift at this hub | 27,514,529 gal/yr | at 95% of national |
| Programme target — 10% of hub | 2,751,453 gal/yr | 10,415,377 L/yr |
| Plant size | 14× the base unit | scaled, −15% cost |
| Capital required | $52.4M | |
| Continuous power | 24,671 kW | 0.9% of the national grid |
| Kerosene production cost | $1.35/L | $5.11/gal |
| Local jet fuel price | $2.00/L | $7.56/gal |
| Aviation margin | +32% | positive |
| Programme revenue | $20,804,716/yr | |
| Programme EBITDA | $6,756,082/yr | |
| Programme payback | 7.8 years | |
| CO₂ removed | 26,299 tonnes/yr | value $5,259,766 |
| O₂ returned | 28,288 tonnes/yr |
| Measure | Value | Notes |
|---|---|---|
| National road fuel | 225,265,152 gal/yr | 852,720,959 L/yr |
| Programme target — 10% of road | 22,526,515 gal/yr | |
| Plant size | 112× the base unit | |
| Capital required | $429M |
The business plan assumptions and sources for this site are available on request.
| Measure | Value | Notes |
|---|---|---|
| Best product | Diesel | |
| Production cost | $1.97/L | $7.46/gal |
| Local market price | $2.90/L | $10.99/gal |
| Margin | 32% | |
| EBITDA per base unit | $707,606/yr | |
| Payback on a base unit | 6.4 years | |
| Products clearing the local price | Diesel, Gasoline, Kerosene | of three |
| Measure | Value | Notes |
|---|---|---|
| Airport | Helsinki-Vantaa (HEL) | Finland's principal hub and a major Asia–Europe transfer point. |
| National jet fuel | 239,404,164 gal/yr | 906,242,918 L/yr |
| Uplift at this hub | 203,493,540 gal/yr | at 85% of national |
| Programme target — 10% of hub | 20,349,354 gal/yr | 77,030,648 L/yr |
| Plant size | 101× the base unit | scaled, −15% cost |
| Capital required | $387.7M | |
| Continuous power | 182,460 kW | 1.0% of the national grid |
| Kerosene production cost | $1.89/L | $7.14/gal |
| Local jet fuel price | $2.09/L | $7.92/gal |
| Aviation margin | +10% | positive |
| Programme revenue | $161,071,085/yr | |
| Programme EBITDA | $15,752,193/yr | |
| Programme payback | 24.6 years | |
| CO₂ removed | 194,502 tonnes/yr | value $38,900,477 |
| O₂ returned | 209,215 tonnes/yr |
| Measure | Value | Notes |
|---|---|---|
| National road fuel | 1,862,032,389 gal/yr | 7,048,556,026 L/yr |
| Programme target — 10% of road | 186,203,239 gal/yr | |
| Plant size | 928× the base unit | |
| Capital required | $3,548M |
The business plan assumptions and sources for this site are available on request.
| Measure | Value | Notes |
|---|---|---|
| Best product | Diesel | |
| Production cost | $1.75/L | $6.62/gal |
| Local market price | $2.60/L | $9.83/gal |
| Margin | 33% | |
| EBITDA per base unit | $643,573/yr | |
| Payback on a base unit | 7.0 years | |
| Products clearing the local price | Diesel, Gasoline, Kerosene | of three |
| Measure | Value | Notes |
|---|---|---|
| Airport | Oslo Gardermoen (OSL) | Norway's principal hub; already a site of aviation-biofuel blending trials. |
| National jet fuel | 323,343,733 gal/yr | 1,223,988,599 L/yr |
| Uplift at this hub | 177,839,053 gal/yr | at 55% of national |
| Programme target — 10% of hub | 17,783,905 gal/yr | 67,319,373 L/yr |
| Plant size | 89× the base unit | scaled, −15% cost |
| Capital required | $338.8M | |
| Continuous power | 159,457 kW | 0.4% of the national grid |
| Kerosene production cost | $1.67/L | $6.34/gal |
| Local jet fuel price | $1.87/L | $7.08/gal |
| Aviation margin | +10% | positive |
| Programme revenue | $125,887,227/yr | |
| Programme EBITDA | $13,176,511/yr | |
| Programme payback | 25.7 years | |
| CO₂ removed | 169,981 tonnes/yr | value $33,996,283 |
| O₂ returned | 182,839 tonnes/yr |
| Measure | Value | Notes |
|---|---|---|
| National road fuel | 2,514,895,698 gal/yr | 9,519,911,324 L/yr |
| Programme target — 10% of road | 251,489,570 gal/yr | |
| Plant size | 1253× the base unit | |
| Capital required | $4,792M |
The business plan assumptions and sources for this site are available on request.
| Measure | Value | Notes |
|---|---|---|
| Best product | Diesel | |
| Production cost | $0.52/L | $1.96/gal |
| Local market price | $1.18/L | $4.47/gal |
| Margin | 56% | |
| EBITDA per base unit | $503,272/yr | |
| Payback on a base unit | 8.9 years | |
| Products clearing the local price | Diesel, Gasoline, Kerosene | of three |
| Measure | Value | Notes |
|---|---|---|
| Airport | Phnom Penh International (PNH) | Cambodia's main international gateway. |
| National jet fuel | 101,453,480 gal/yr | 384,043,018 L/yr |
| Uplift at this hub | 71,017,436 gal/yr | at 70% of national |
| Programme target — 10% of hub | 7,101,744 gal/yr | 26,883,011 L/yr |
| Plant size | 35× the base unit | scaled, −15% cost |
| Capital required | $135.3M | |
| Continuous power | 63,677 kW | 2.1% of the national grid |
| Kerosene production cost | $0.50/L | $1.89/gal |
| Local jet fuel price | $0.85/L | $3.22/gal |
| Aviation margin | +41% | positive |
| Programme revenue | $22,850,560/yr | |
| Programme EBITDA | $9,412,264/yr | |
| Programme payback | 14.4 years | |
| CO₂ removed | 67,880 tonnes/yr | value $13,575,921 |
| O₂ returned | 73,014 tonnes/yr |
| Measure | Value | Notes |
|---|---|---|
| National road fuel | 789,082,623 gal/yr | 2,987,001,252 L/yr |
| Programme target — 10% of road | 78,908,262 gal/yr | |
| Plant size | 393× the base unit | |
| Capital required | $1,503M |
The business plan assumptions and sources for this site are available on request.
| Measure | Value | Notes |
|---|---|---|
| Best product | Diesel | |
| Production cost | $0.87/L | $3.31/gal |
| Local market price | $1.18/L | $4.47/gal |
| Margin | 26% | |
| EBITDA per base unit | $232,695/yr | |
| Payback on a base unit | 19.3 years | |
| Products clearing the local price | Diesel, Gasoline, Kerosene | of three |
| Measure | Value | Notes |
|---|---|---|
| Airport | Yangon International (RGN) | Myanmar's principal international airport. |
| National jet fuel | 172,897,106 gal/yr | 654,486,432 L/yr |
| Uplift at this hub | 129,672,829 gal/yr | at 75% of national |
| Programme target — 10% of hub | 12,967,283 gal/yr | 49,086,482 L/yr |
| Plant size | 65× the base unit | scaled, −15% cost |
| Capital required | $247.1M | |
| Continuous power | 116,270 kW | 1.9% of the national grid |
| Kerosene production cost | $0.84/L | $3.18/gal |
| Local jet fuel price | $0.85/L | $3.22/gal |
| Aviation margin | +1% | positive |
| Programme revenue | $41,723,510/yr | |
| Programme EBITDA | $517,240/yr | |
| Programme payback | 477.7 years | |
| CO₂ removed | 123,943 tonnes/yr | value $24,788,674 |
| O₂ returned | 133,319 tonnes/yr |
| Measure | Value | Notes |
|---|---|---|
| National road fuel | 1,344,755,265 gal/yr | 5,090,450,028 L/yr |
| Programme target — 10% of road | 134,475,526 gal/yr | |
| Plant size | 670× the base unit | |
| Capital required | $2,562M |
The business plan assumptions and sources for this site are available on request.
| Measure | Value | Notes |
|---|---|---|
| Best product | Diesel | |
| Production cost | $0.98/L | $3.70/gal |
| Local market price | $1.24/L | $4.69/gal |
| Margin | 21% | |
| EBITDA per base unit | $198,612/yr | |
| Payback on a base unit | 22.7 years | |
| Products clearing the local price | Diesel, Gasoline | of three |
| Measure | Value | Notes |
|---|---|---|
| Airport | Bandaranaike International (CMB) | Sri Lanka's main hub, near Colombo. |
| National jet fuel | 126,879,971 gal/yr | 480,292,713 L/yr |
| Uplift at this hub | 114,191,974 gal/yr | at 90% of national |
| Programme target — 10% of hub | 11,419,197 gal/yr | 43,226,344 L/yr |
| Plant size | 57× the base unit | scaled, −15% cost |
| Capital required | $217.6M | |
| Continuous power | 102,389 kW | 2.1% of the national grid |
| Kerosene production cost | $0.94/L | $3.55/gal |
| Local jet fuel price | $0.89/L | $3.38/gal |
| Aviation margin | -5% | LOSS at the local price |
| Programme revenue | $38,579,512/yr | |
| Programme EBITDA | $-1,988,734/yr | |
| Programme payback | n/a — loss-making on price | |
| CO₂ removed | 109,147 tonnes/yr | value $21,829,304 |
| O₂ returned | 117,403 tonnes/yr |
| Measure | Value | Notes |
|---|---|---|
| National road fuel | 986,844,222 gal/yr | 3,735,609,986 L/yr |
| Programme target — 10% of road | 98,684,422 gal/yr | |
| Plant size | 492× the base unit | |
| Capital required | $1,880M |
The business plan assumptions and sources for this site are available on request.
| Measure | Value | Notes |
|---|---|---|
| Best product | Diesel | |
| Production cost | $2.13/L | $8.08/gal |
| Local market price | $2.36/L | $8.93/gal |
| Margin | 10% | |
| EBITDA per base unit | $171,107/yr | |
| Payback on a base unit | 26.3 years | |
| Products clearing the local price | Diesel, Gasoline | of three |
| Measure | Value | Notes |
|---|---|---|
| Airport | Madrid-Barajas (MAD) | Spain's largest hub; Barcelona (BCN) is the obvious second site. |
| National jet fuel | 1,824,642,212 gal/yr | 6,907,018,877 L/yr |
| Uplift at this hub | 638,624,774 gal/yr | at 35% of national |
| Programme target — 10% of hub | 63,862,477 gal/yr | 241,745,661 L/yr |
| Plant size | 318× the base unit | scaled, −15% cost |
| Capital required | $1,216.8M | |
| Continuous power | 572,615 kW | 0.5% of the national grid |
| Kerosene production cost | $2.04/L | $7.73/gal |
| Local jet fuel price | $1.70/L | $6.44/gal |
| Aviation margin | -20% | LOSS at the local price |
| Programme revenue | $410,967,623/yr | |
| Programme EBITDA | $-82,713,097/yr | |
| Programme payback | n/a — loss-making on price | |
| CO₂ removed | 610,408 tonnes/yr | value $122,081,559 |
| O₂ returned | 656,581 tonnes/yr |
| Measure | Value | Notes |
|---|---|---|
| National road fuel | 14,191,661,652 gal/yr | 53,721,257,934 L/yr |
| Programme target — 10% of road | 1,419,166,165 gal/yr | |
| Plant size | 7069× the base unit | |
| Capital required | $27,040M |
The business plan assumptions and sources for this site are available on request.
| Measure | Value | Notes |
|---|---|---|
| Best product | Diesel | |
| Production cost | $2.36/L | $8.92/gal |
| Local market price | $2.54/L | $9.60/gal |
| Margin | 7% | |
| EBITDA per base unit | $136,502/yr | |
| Payback on a base unit | 33.0 years | |
| Products clearing the local price | Diesel, Gasoline | of three |
| Measure | Value | Notes |
|---|---|---|
| Airport | Stockholm Arlanda (ARN) | Sweden's principal hub. |
| National jet fuel | 366,284,136 gal/yr | 1,386,535,630 L/yr |
| Uplift at this hub | 219,770,481 gal/yr | at 60% of national |
| Programme target — 10% of hub | 21,977,048 gal/yr | 83,192,138 L/yr |
| Plant size | 109× the base unit | scaled, −15% cost |
| Capital required | $418.7M | |
| Continuous power | 197,055 kW | 0.4% of the national grid |
| Kerosene production cost | $2.25/L | $8.53/gal |
| Local jet fuel price | $1.83/L | $6.92/gal |
| Aviation margin | -23% | LOSS at the local price |
| Programme revenue | $152,033,632/yr | |
| Programme EBITDA | $-35,513,730/yr | |
| Programme payback | n/a — loss-making on price | |
| CO₂ removed | 210,060 tonnes/yr | value $42,012,030 |
| O₂ returned | 225,950 tonnes/yr |
| Measure | Value | Notes |
|---|---|---|
| National road fuel | 2,848,876,611 gal/yr | 10,784,166,012 L/yr |
| Programme target — 10% of road | 284,887,661 gal/yr | |
| Plant size | 1419× the base unit | |
| Capital required | $5,428M |
The business plan assumptions and sources for this site are available on request.
| Measure | Value | Notes |
|---|---|---|
| Best product | Diesel | |
| Production cost | $3.40/L | $12.85/gal |
| Local market price | $3.46/L | $13.09/gal |
| Margin | 2% | |
| EBITDA per base unit | $46,750/yr | |
| Payback on a base unit | 96.3 years | |
| Products clearing the local price | Diesel | of three |
| Measure | Value | Notes |
|---|---|---|
| Airport | Amsterdam Schiphol (AMS) | One of Europe's largest hubs; very large uplift. |
| National jet fuel | 1,128,409,720 gal/yr | 4,271,493,439 L/yr |
| Uplift at this hub | 1,015,568,748 gal/yr | at 90% of national |
| Programme target — 10% of hub | 101,556,875 gal/yr | 384,434,410 L/yr |
| Plant size | 506× the base unit | scaled, −15% cost |
| Capital required | $1,935.0M | |
| Continuous power | 910,598 kW | 2.3% of the national grid |
| Kerosene production cost | $3.24/L | $12.28/gal |
| Local jet fuel price | $2.49/L | $9.43/gal |
| Aviation margin | -30% | LOSS at the local price |
| Programme revenue | $957,433,897/yr | |
| Programme EBITDA | $-289,992,646/yr | |
| Programme payback | n/a — loss-making on price | |
| CO₂ removed | 970,697 tonnes/yr | value $194,139,377 |
| O₂ returned | 1,044,124 tonnes/yr |
| Measure | Value | Notes |
|---|---|---|
| National road fuel | 8,776,520,046 gal/yr | 33,222,726,747 L/yr |
| Programme target — 10% of road | 877,652,005 gal/yr | |
| Plant size | 4372× the base unit | |
| Capital required | $16,722M |
The business plan assumptions and sources for this site are available on request.
| Measure | Value | Notes |
|---|---|---|
| Best product | Diesel | |
| Production cost | $2.48/L | $9.37/gal |
| Local market price | $2.54/L | $9.60/gal |
| Margin | 2% | |
| EBITDA per base unit | $46,310/yr | |
| Payback on a base unit | 97.2 years | |
| Products clearing the local price | Diesel | of three |
| Measure | Value | Notes |
|---|---|---|
| Airport | Lisbon Humberto Delgado (LIS) | Portugal's principal hub. |
| National jet fuel | 301,486,525 gal/yr | 1,141,250,107 L/yr |
| Uplift at this hub | 165,817,589 gal/yr | at 55% of national |
| Programme target — 10% of hub | 16,581,759 gal/yr | 62,768,756 L/yr |
| Plant size | 83× the base unit | scaled, −15% cost |
| Capital required | $315.9M | |
| Continuous power | 148,678 kW | 0.7% of the national grid |
| Kerosene production cost | $2.37/L | $8.96/gal |
| Local jet fuel price | $1.83/L | $6.92/gal |
| Aviation margin | -30% | LOSS at the local price |
| Programme revenue | $114,709,901/yr | |
| Programme EBITDA | $-33,900,281/yr | |
| Programme payback | n/a — loss-making on price | |
| CO₂ removed | 158,491 tonnes/yr | value $31,698,222 |
| O₂ returned | 170,480 tonnes/yr |
| Measure | Value | Notes |
|---|---|---|
| National road fuel | 2,344,895,196 gal/yr | 8,876,389,724 L/yr |
| Programme target — 10% of road | 234,489,520 gal/yr | |
| Plant size | 1168× the base unit | |
| Capital required | $4,468M |
Power is not the constraint; margin is. Every airport programme in this list draws between 0.4% and 2.3% of its national grid — large, but absorbable, and Iceland's 25 MW is under one percent of a grid with surplus renewable capacity.
Only two of the ten support aviation on price. Iceland (32% kerosene margin) and Cambodia (41%) clear the local jet price. Finland, Norway and Myanmar are thin. Sri Lanka, Spain, Sweden, the Netherlands and Portugal lose money against untaxed jet fuel — for those five the airport programme only works under a RefuelEU-style mandate, where the buyer must comply and the alternative is a penalty rather than cheaper fossil fuel.
Iceland is the entry point. Fourteen base units, or one plant scaled to the same output for $52M, at Keflavík — the only aviation programme in the database under $100M, in a country with cheap unsubsidised power, no fuel subsidy, all three products viable, and 0.9% of the grid required.
Every site in the database. Select a country and a location to see its economics across all three products, at your chosen electricity price basis. Figures in both litres and US gallons.
| Country | |
| Location | |
| Price basis | |
| Tariff ($/kWh) | |
| Units |
Every litre of fuel Fuel From Air produces draws carbon dioxide out of the atmosphere and returns pure oxygen to it. The quantities come from FFA's own constants. So does the honest limit on what that means.
| Fuel | CO₂ removed (kg/L) | CO₂ removed (kg/gal) | O₂ returned (kg/L) | O₂ returned (kg/gal) |
|---|---|---|---|---|
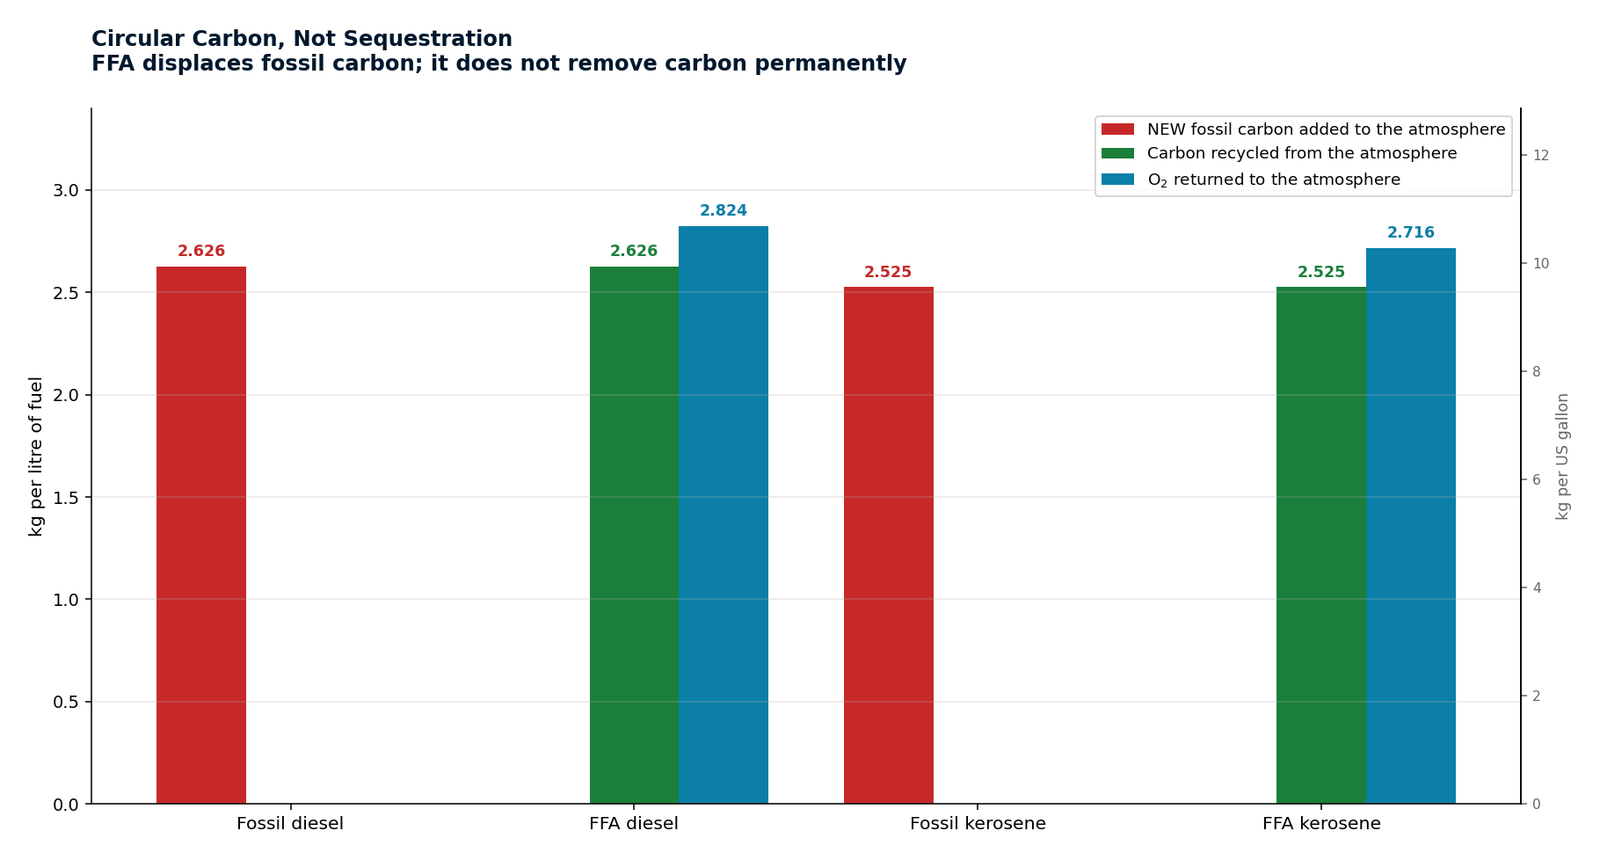
| Diesel | 2.626 | 9.940 | 2.824 | 10.690 |
| Gasoline | 2.296 | 8.691 | 2.609 | 9.876 |
| Kerosene / Jet A1 | 2.525 | 9.558 | 2.716 | 10.281 |
Source: fuelfromair.com FUELS array — FFA's own per-fuel constants.
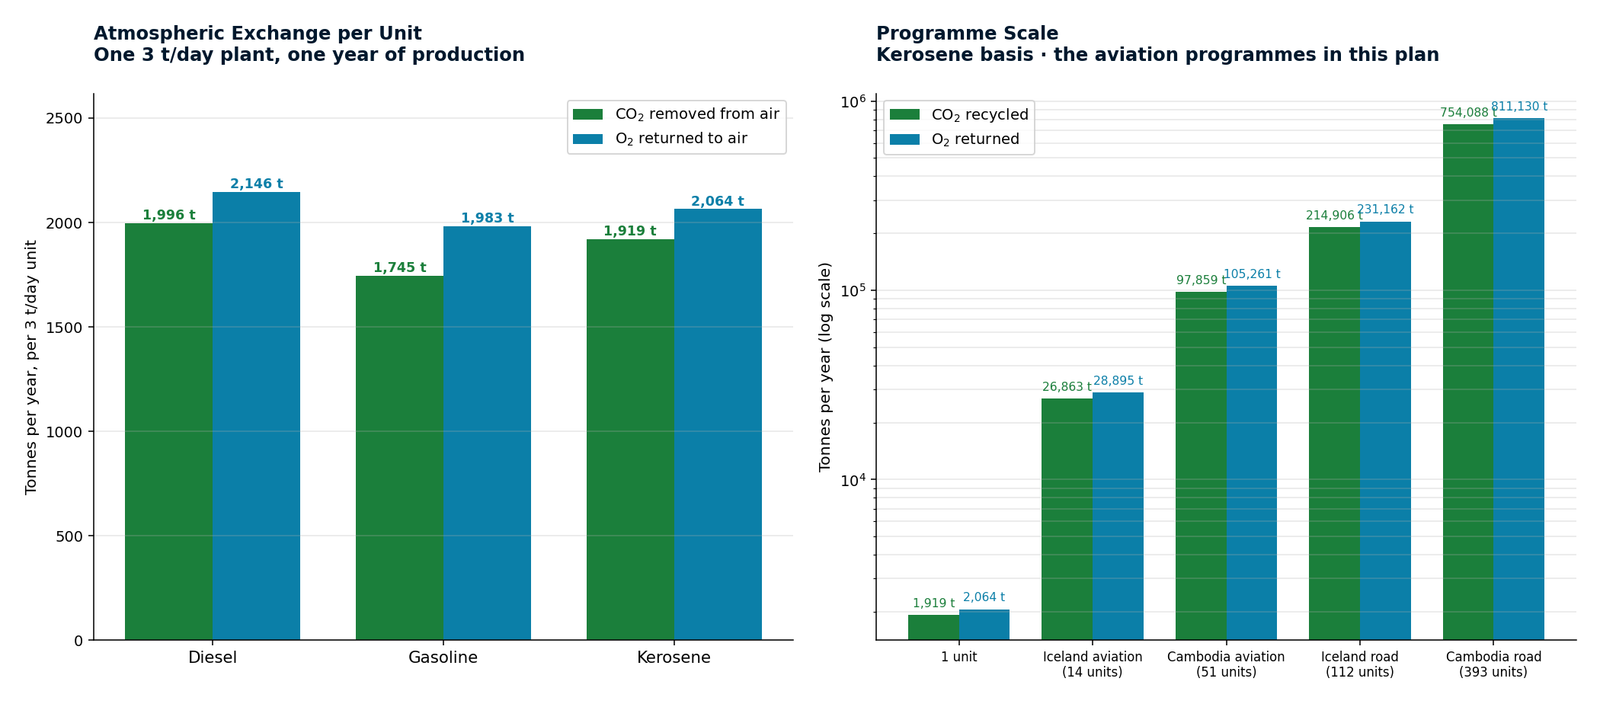
One unit produces 759,921 litres (200,750 US gallons) of finished fuel a year. On the diesel basis that draws 1,996 tonnes of CO₂ from the atmosphere and returns 2,146 tonnes of pure O₂ to it. On the kerosene basis — the aviation case — it is 1,919 tonnes and 2,064 tonnes. A single unit handles the carbon of roughly 430 cars.
A car covering 12,000 miles a year at 25.5 mpg burns 470.6 gallons. On fossil gasoline that adds 4.09 tonnes of new carbon to the atmosphere — carbon that had been underground for millions of years. On FFA gasoline the same 4.09 tonnes is drawn from the air to make the fuel and returned when it burns. Net addition: zero.
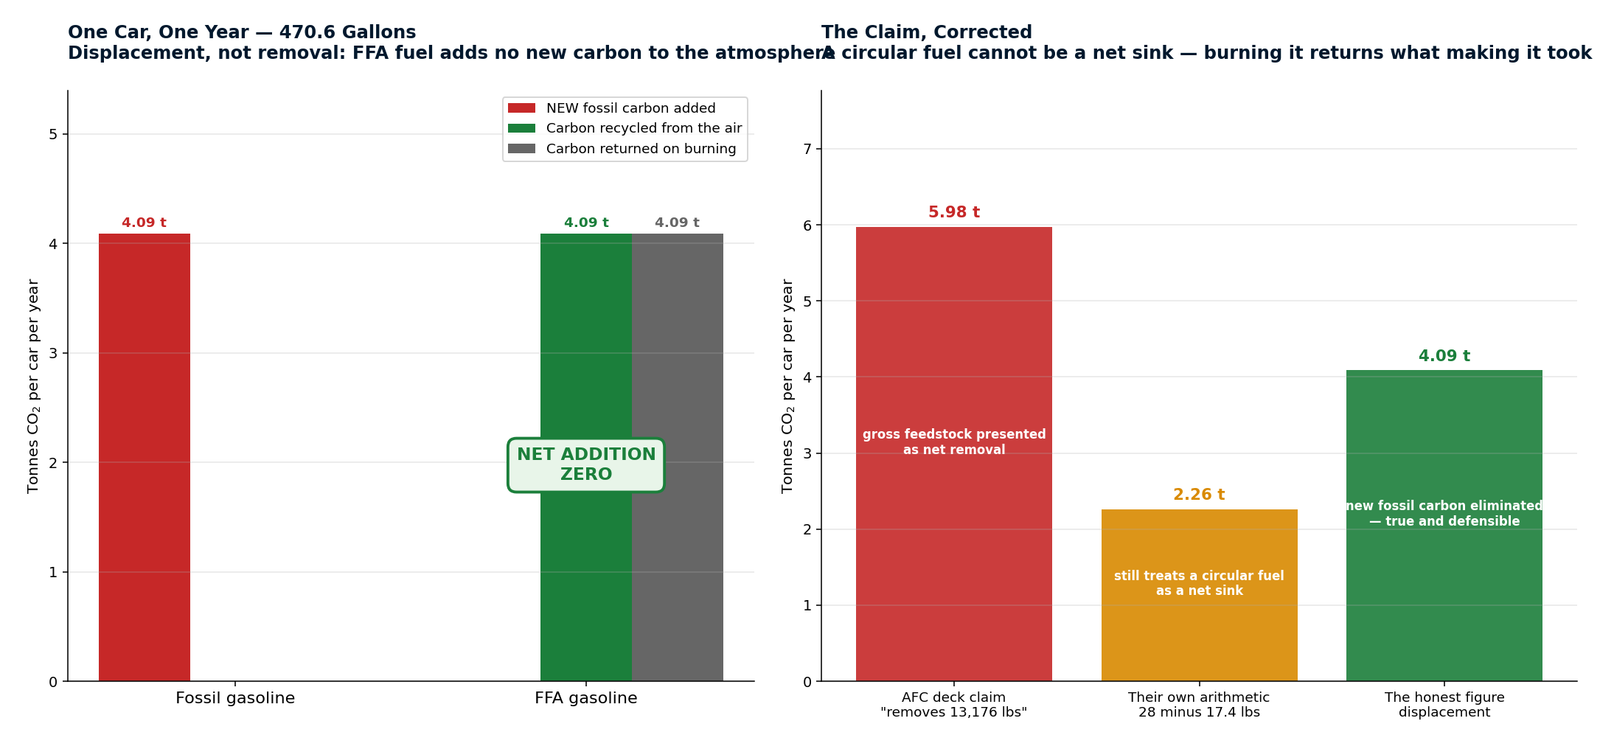
Arizona Fuels Corporation's CO₂ Extraction deck states that each car running on AFC fuel “will remove 13,176 lbs of CO₂ from the atmosphere each year”, and that the US fleet would remove 2,423 million tonnes annually. Neither figure survives scrutiny, and both should be corrected before the deck is shown to an investor or a regulator.
The arithmetic does not match the slide. 470.6 gallons × 28 lbs is 13,177 lbs of CO₂ consumed as feedstock. The same slide states that burning the fuel emits 8,188 lbs. A removal figure would be the difference — 4,988 lbs, not 13,176. The larger number is gross consumption presented as net removal.
And even 4,988 lbs is not removal. A circular fuel cannot be a net sink: the carbon that goes in comes back out when the fuel is burned. Cross-checked against EPA figures, a gallon of gasoline contains about 2.42 kg of carbon — 19.6 lbs of CO₂. The deck's 28 lbs is 1.43× that, and the excess is process loss, not sequestration. It does not stay out of the atmosphere.
“Removes 2,423 million tonnes” is false, and a regulator or a serious investor will find that out in an afternoon. “Eliminates 1,700 million tonnes of new fossil carbon a year” is true — and it is the entire decarbonisation case for US ground transport in a single line.
FFA does not need to claim removal. Displacing every tonne of new carbon from a sector that cannot electrify is a complete argument on its own, and it is one that survives audit.
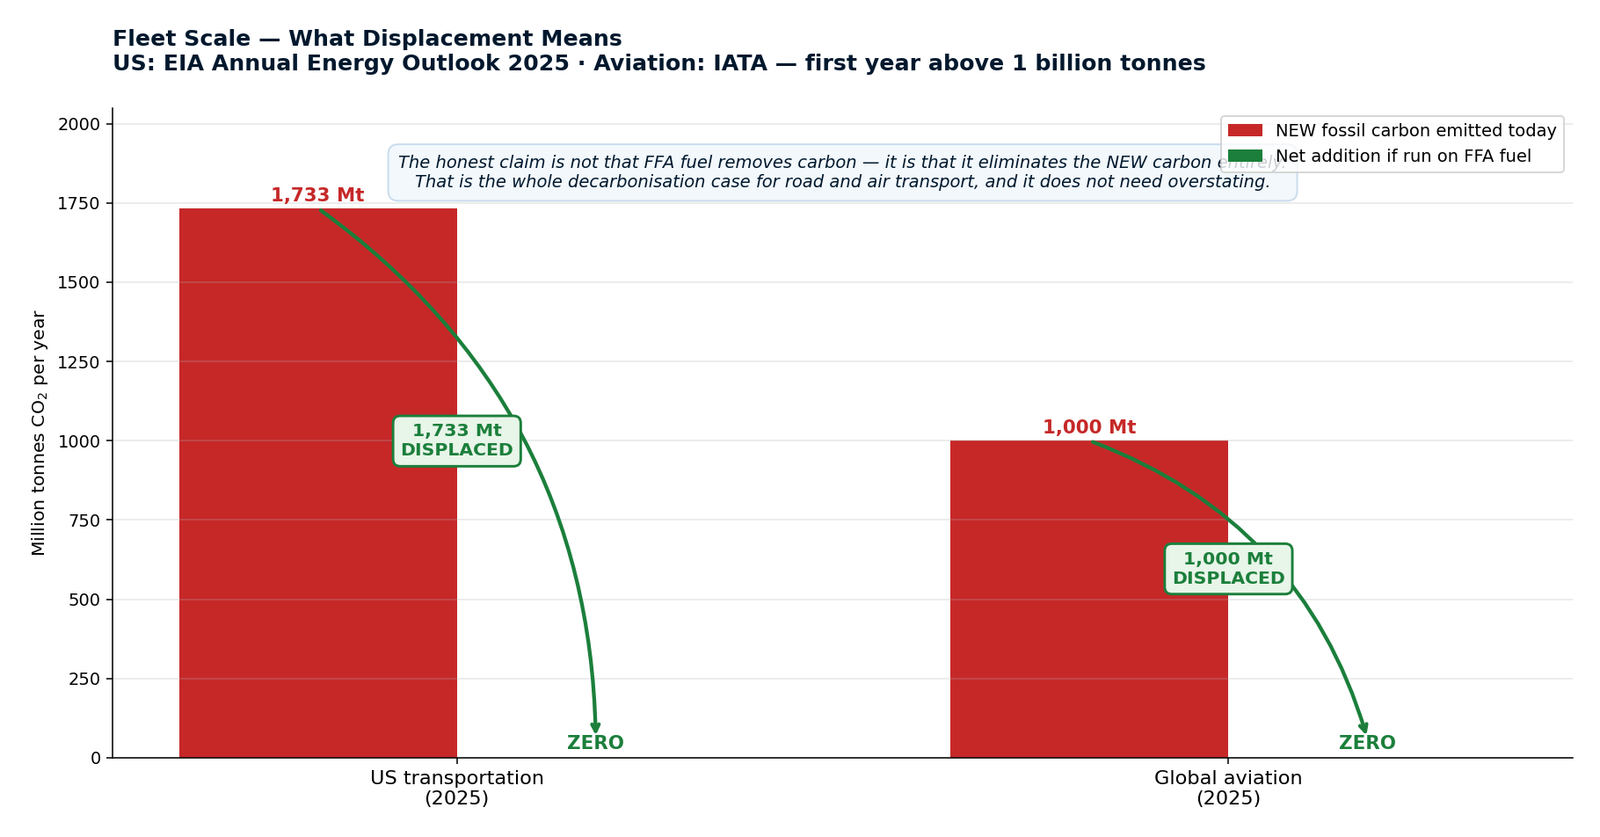
Market figures from Arizona Fuels Corporation, CO₂ Extraction (2015 basis). Displacement computed on fuelfromair.com's own constants: 2.296 kg CO₂ per litre of gasoline (8.691 kg/gal, 19.2 lbs/gal). Note this differs from the AFC deck's 28 lbs/gal; the site figure is used throughout this analysis.
This is the point on which the environmental claim stands or falls, and it should be stated before anyone else states it.
FFA's carbon is circular, not sequestered. The CO₂ drawn from the air to make a litre is released again when that litre is burned. Fuel From Air is not a carbon sink and does not claim to be one.
The benefit is displacement. A litre of fossil diesel adds 2.626 kg of new carbon to the atmosphere — carbon that sat underground for millions of years. A litre of FFA diesel recycles 2.626 kg that was already in the air. Net addition: zero. That is a real and substantial benefit, and it is a different claim from removal.
The oxygen is a genuine by-product. Splitting water to make hydrogen releases O₂, and the process vents it. It is not a carbon claim and should not be presented as one — but it is a real output, and industrial and medical oxygen is a real market worth investigating as a by-product line.
A deep look at the carbon markets, what a credit actually is, and an honest assessment of which of them Fuel From Air can enter. The conclusion materially changes Pillar 4.
A carbon credit is one tonne of CO₂ that either was not emitted, or was taken out of the air and kept out. Those two things sound similar and price completely differently.
Avoidance credits represent emissions that did not happen — a forest not felled, a coal plant not built. They are abundant, contested, and cheap: generic avoidance trades below $5 a tonne, and the weighted average spot price across the whole voluntary market is about $5.60.
Removal credits (CDR) represent a tonne physically extracted from the atmosphere and stored. They are scarce and expensive: biochar $189–200, enhanced rock weathering $400, direct air capture with storage $450 to over $1,000 a tonne in 2026 forward offers.
Compliance markets are a separate system entirely. EU ETS allowances are projected to average $91–93 a tonne in 2026 and are set by auction, not project economics. They cannot be used against a voluntary net-zero claim, and voluntary credits cannot be surrendered against an ETS obligation.
The EU's Carbon Removals Certification Framework (Regulation 2024/3012) sets three durability tiers for a removal credit: permanent removals requiring centuries of storage, carbon storage in products requiring a minimum of 35 years, and carbon farming requiring a minimum of five.
FFA's carbon comes out of the air and goes back into it the moment the fuel is burned — a matter of weeks. It meets none of those tiers.
Fuel From Air cannot sell removal credits on its fuel carbon. Any model showing Pillar 4 earning $200 a tonne of removal credits is modelling revenue that does not exist.
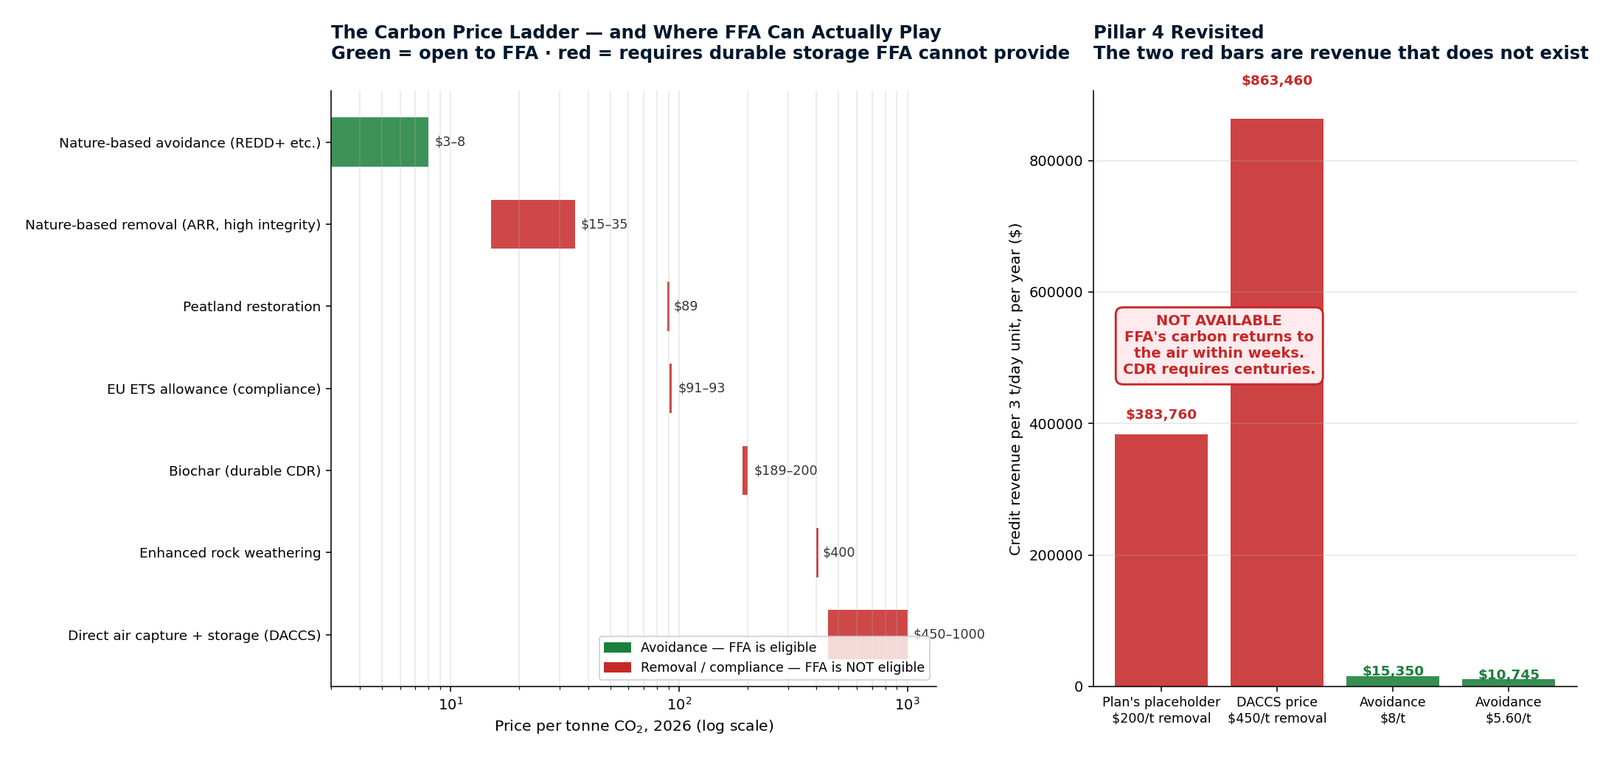
| Basis | Revenue per unit per year | Verdict |
|---|---|---|
| Removal credit — the plan's placeholder | $383,760 | NOT AVAILABLE — fails durability |
| Removal credit at $450/t — DACCS forward | $863,460 | NOT AVAILABLE — fails durability |
| Avoidance credit at $8/t | $15,350 | Available, but marginal |
| Avoidance at $5.60/t — weighted spot average | $10,745 | Available, but marginal |
The gap between the placeholder and the reality is a factor of 25 to 36.
1. Avoided emissions, not removals. Every litre of FFA fuel displaces a litre of fossil fuel that would have added new carbon. That avoided tonne is real and saleable — but it prices as avoidance, at single digits per tonne, not as removal.
2. The fuel itself, into a mandate — and this is where the value sits. Under RefuelEU Aviation the buyer must blend synthetic fuel regardless of price; the alternative is a penalty, not cheaper fossil. FFA is not selling a credit at all here — it is selling a compliance product at a premium. That is Anchor 2, and it is worth far more than any credit line.
3. Aviation compliance channels. CORSIA Phase I (2024–2026) has created the first concrete compliance demand in aviation. Decisions on including CDR in the UK SAF mandate and in national ETS programmes could open further channels — but for the fuel, not for FFA's circular carbon.
4. The oxygen, as an industrial commodity. Each unit vents roughly 2,064 tonnes of pure O₂ a year. Medical and industrial oxygen is a genuine market and worth investigating as a by-product line. It is not an environmental credit and must not be dressed as one.
The question of whether FFA can offset and market to big users has a clear answer, but not the expected one. A corporate buyer with a net-zero commitment wants removal, and increasingly wants durable removal — the Oxford Principles push buyers up the durability ladder, not down it. FFA cannot supply that.
What FFA can supply is a fuel with a materially lower carbon intensity than the fossil alternative. An airline, a haulier or a mining operation does not want a certificate — it wants to reduce the emissions it reports, and buying FFA fuel does that directly and verifiably. The transaction is a fuel supply contract, not a credit trade.
That is a better business in any case. Credit markets are volatile, contested and thin: the voluntary market is worth around €3bn in 2026 against a global fuel market measured in trillions, retirements fell 7% last year, and integrity standards are tightening against exactly the kind of claim a circular fuel might be tempted to make. Selling fuel into a mandate is a larger, firmer and more defensible position than selling credits into a market that would rightly question them.
The atmospheric exchange, the honest comparison against fossil fuel, and the carbon-credit reality. Every litre FFA produces takes CO₂ from the air and returns pure O₂ — but the carbon is recycled, not sequestered, and that distinction decides what can be sold.
One 3 t/day unit draws 1,745–1,996 tonnes of CO₂ a year depending on product, and returns 1,983–2,146 tonnes of pure oxygen.
A litre of fossil diesel adds 2.626 kg of new carbon. A litre of FFA diesel recycles 2.626 kg already in the air. Net addition zero — displacement, not removal.
Removal credits price at $189–1,000 a tonne but require durable storage FFA cannot provide. Avoidance credits are open to FFA at $5.60–8. The gap against the plan's $200 placeholder is 25–36×.
3 charts in this group. Sources: Sylvera, Regreener, Senken and Carbon Direct 2026 market data; EU Regulation 2024/3012 (CRCF).
Electricity is the decisive variable: the local tariff, not the technology, determines whether a site is a business or a loss, and the plant is identical in both places. These four charts map that spread across the original 394 locations and identify where the economics actually close.
Electricity is almost the whole cost of the fuel. The original 394-location database holds retail tariffs — its business column is labelled a proxy in FFA's own workbook, median $0.185/kWh. A plant operator signs a power-purchase agreement: real corporate PPAs are far below retail, and FFA's own workbook records the Cambodia National Solar Park. This analysis uses a representative PPA as the base case throughout, with retail shown as a sensitivity (basis available on request). On the proxy, the case is understated several-fold — gasoline reads $2.59/L instead of $0.73/L, and viability 8 of 68 instead of 63.
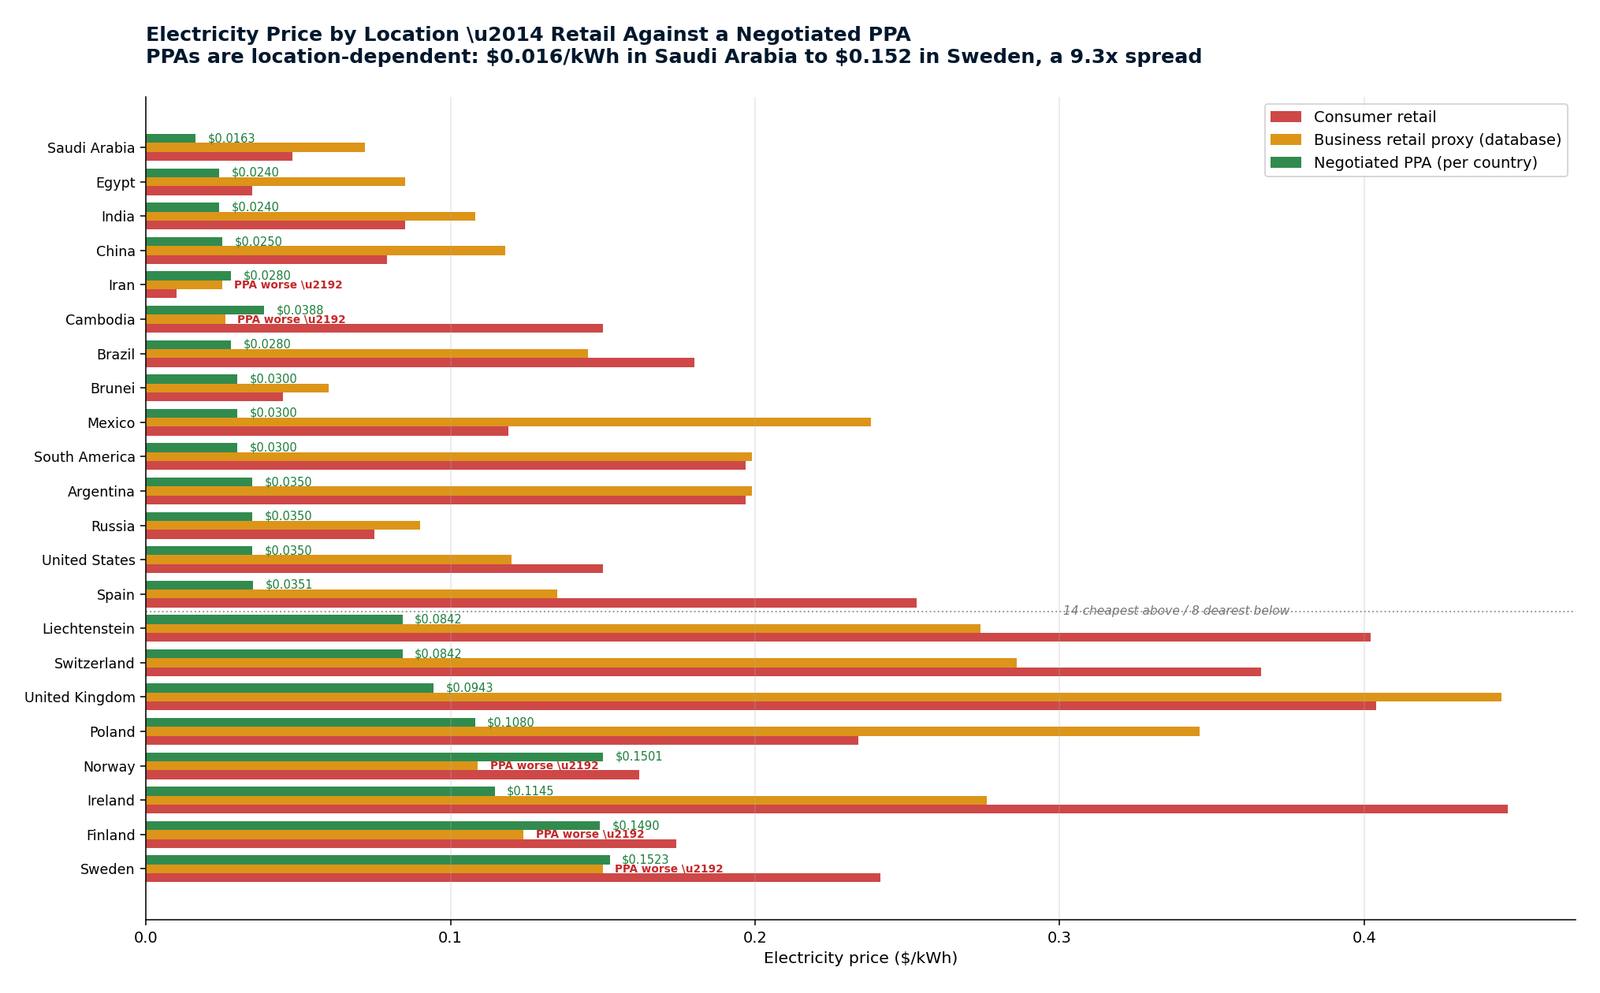
A PPA prices the local generation cost, resource quality and cost of capital — none of which are uniform. Real 2026 PPAs run from $0.0163/kWh in Saudi Arabia to $0.1523 in Sweden, a 9.3× spread. In five countries — Iran, Cambodia, Finland, Norway and Sweden — the PPA is dearer than the retail tariff, so an operator there signs a retail contract instead. The model uses min(PPA, retail) at every site.
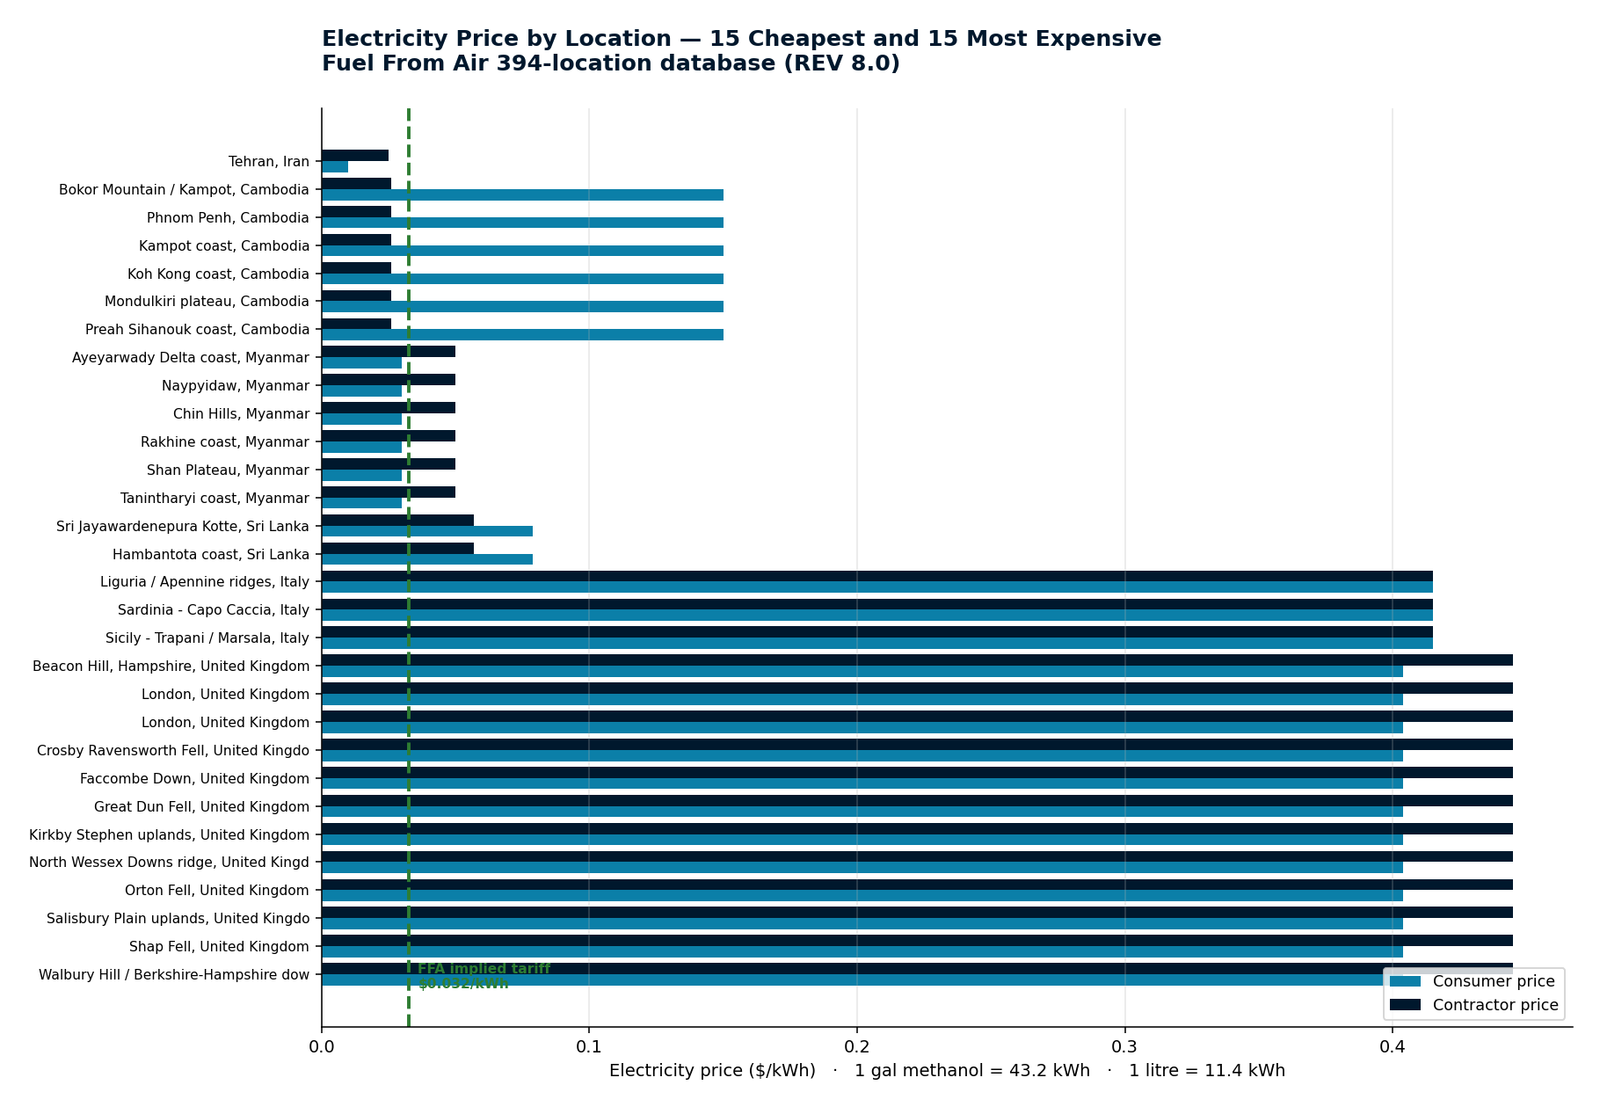
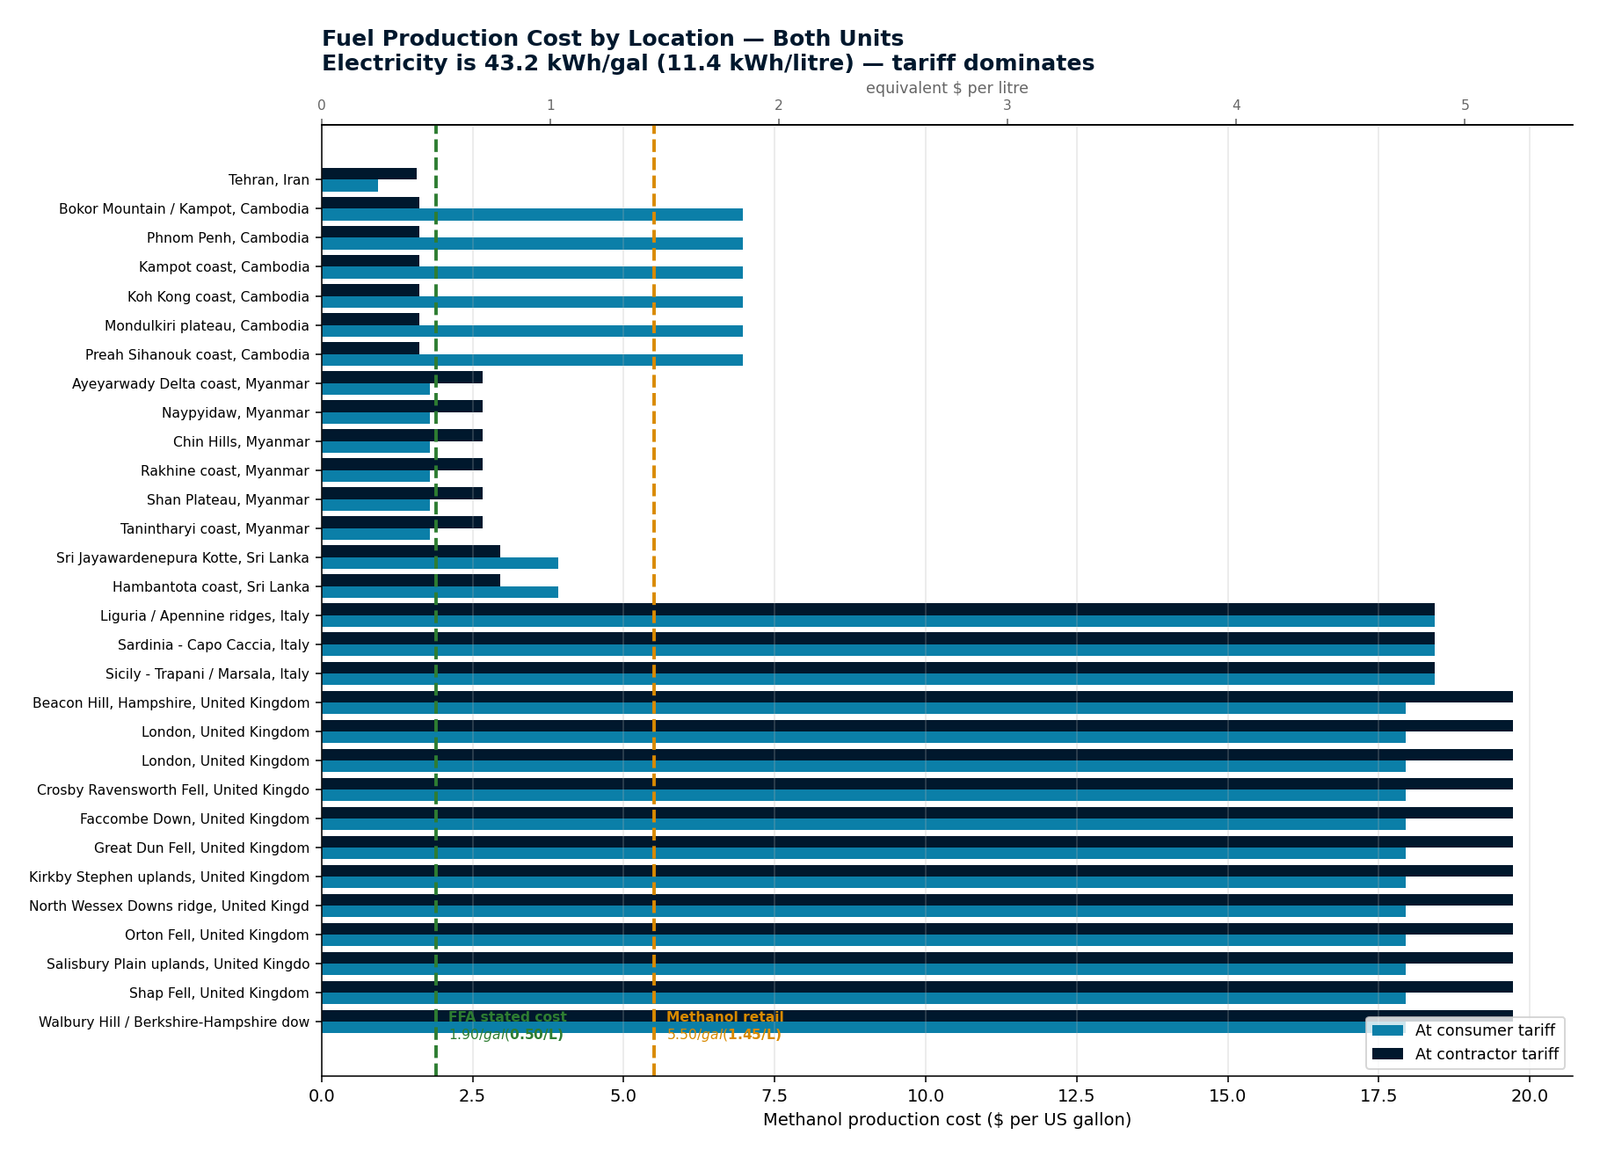
The 15 cheapest and 15 most expensive sites, consumer against contractor tariff. The green line is the tariff implied by FFA's own $1.90/gal figure — very few sites reach it.
The same sites, converted to production cost. Two reference lines: FFA's stated $1.90/gal ($0.50/L) and the $5.50/gal ($1.45/L) retail price. A site only works if its bar sits left of the retail line.
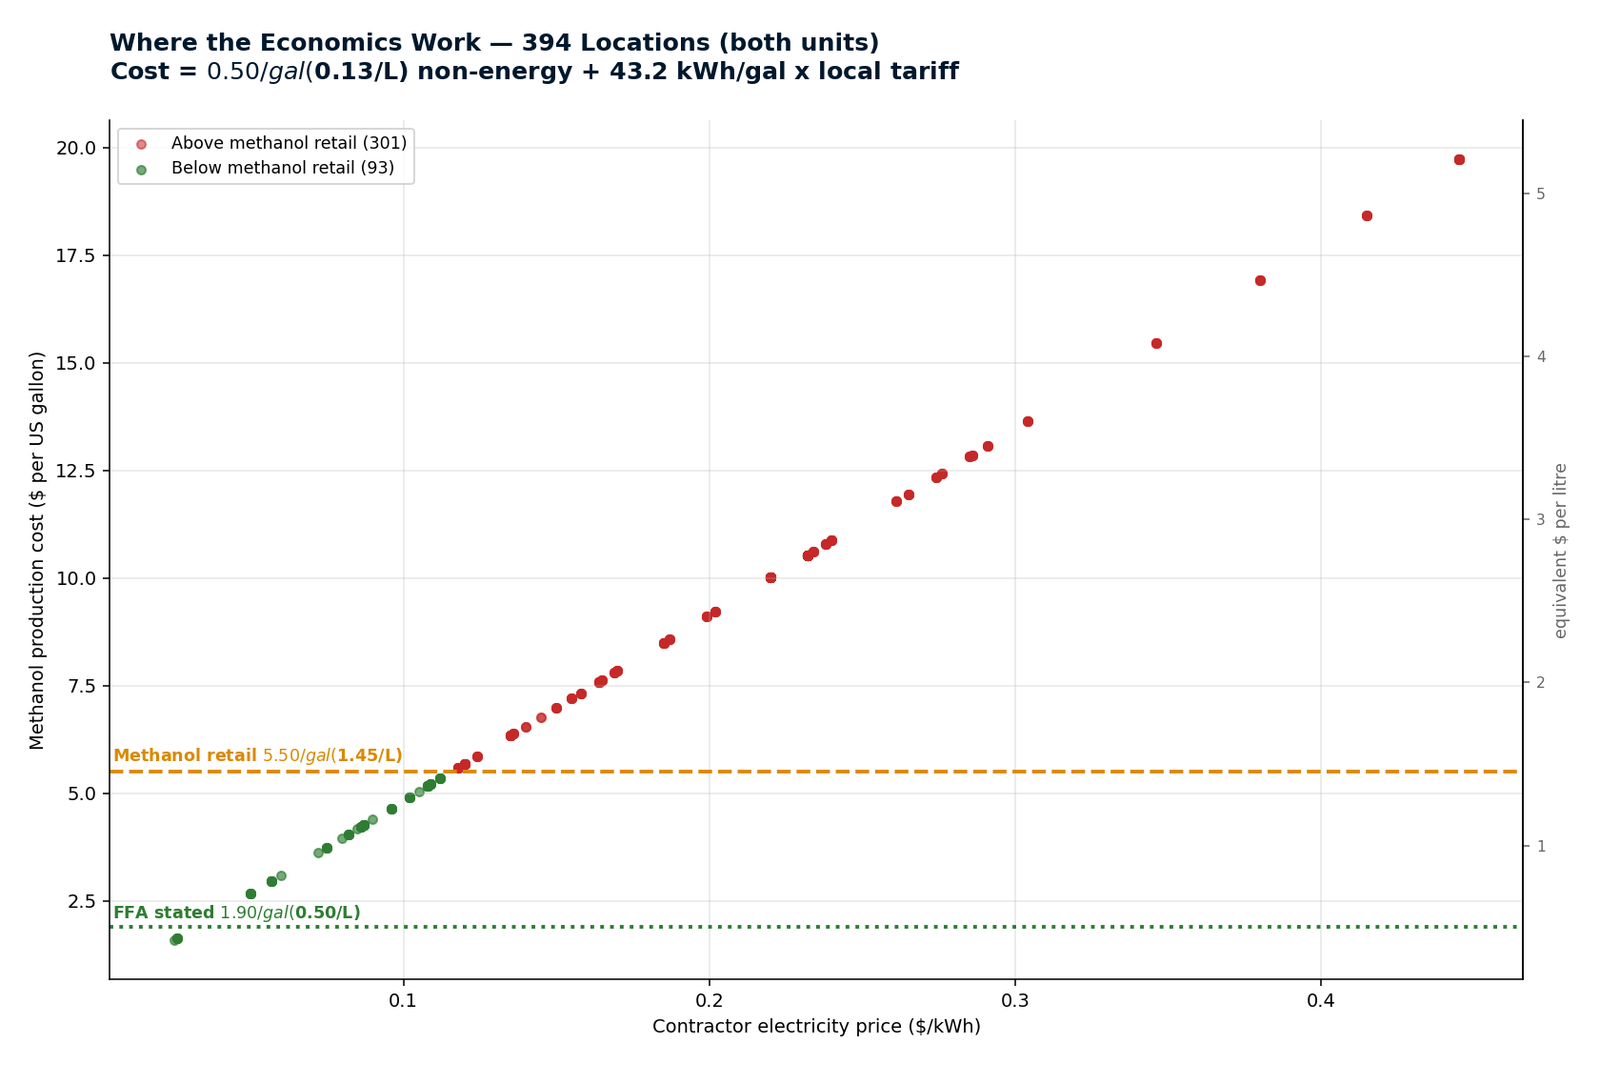
Every site plotted against its tariff. 93 of 394 produce below the retail price; 301 do not. Knowing which is which is what Pillar 2 licenses.
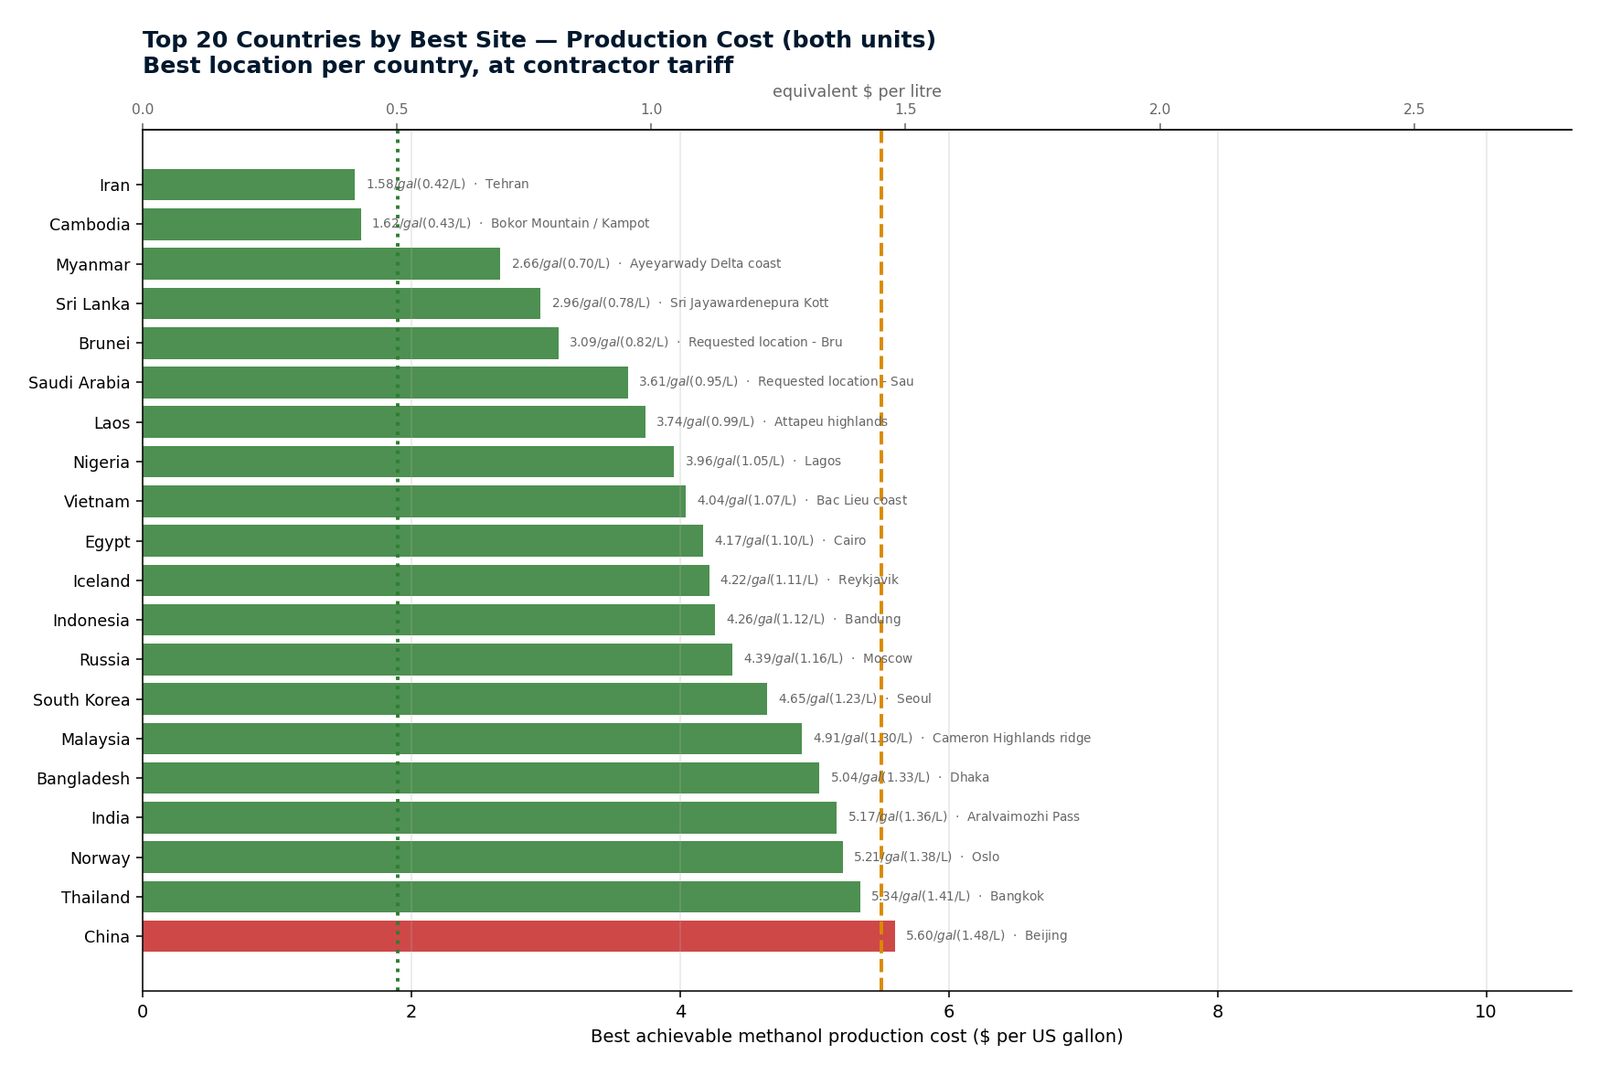
The cheapest-power location in each country, labelled with its tariff. These are P1's deployment candidates.
4 charts in this group. All figures in both litres and US gallons.
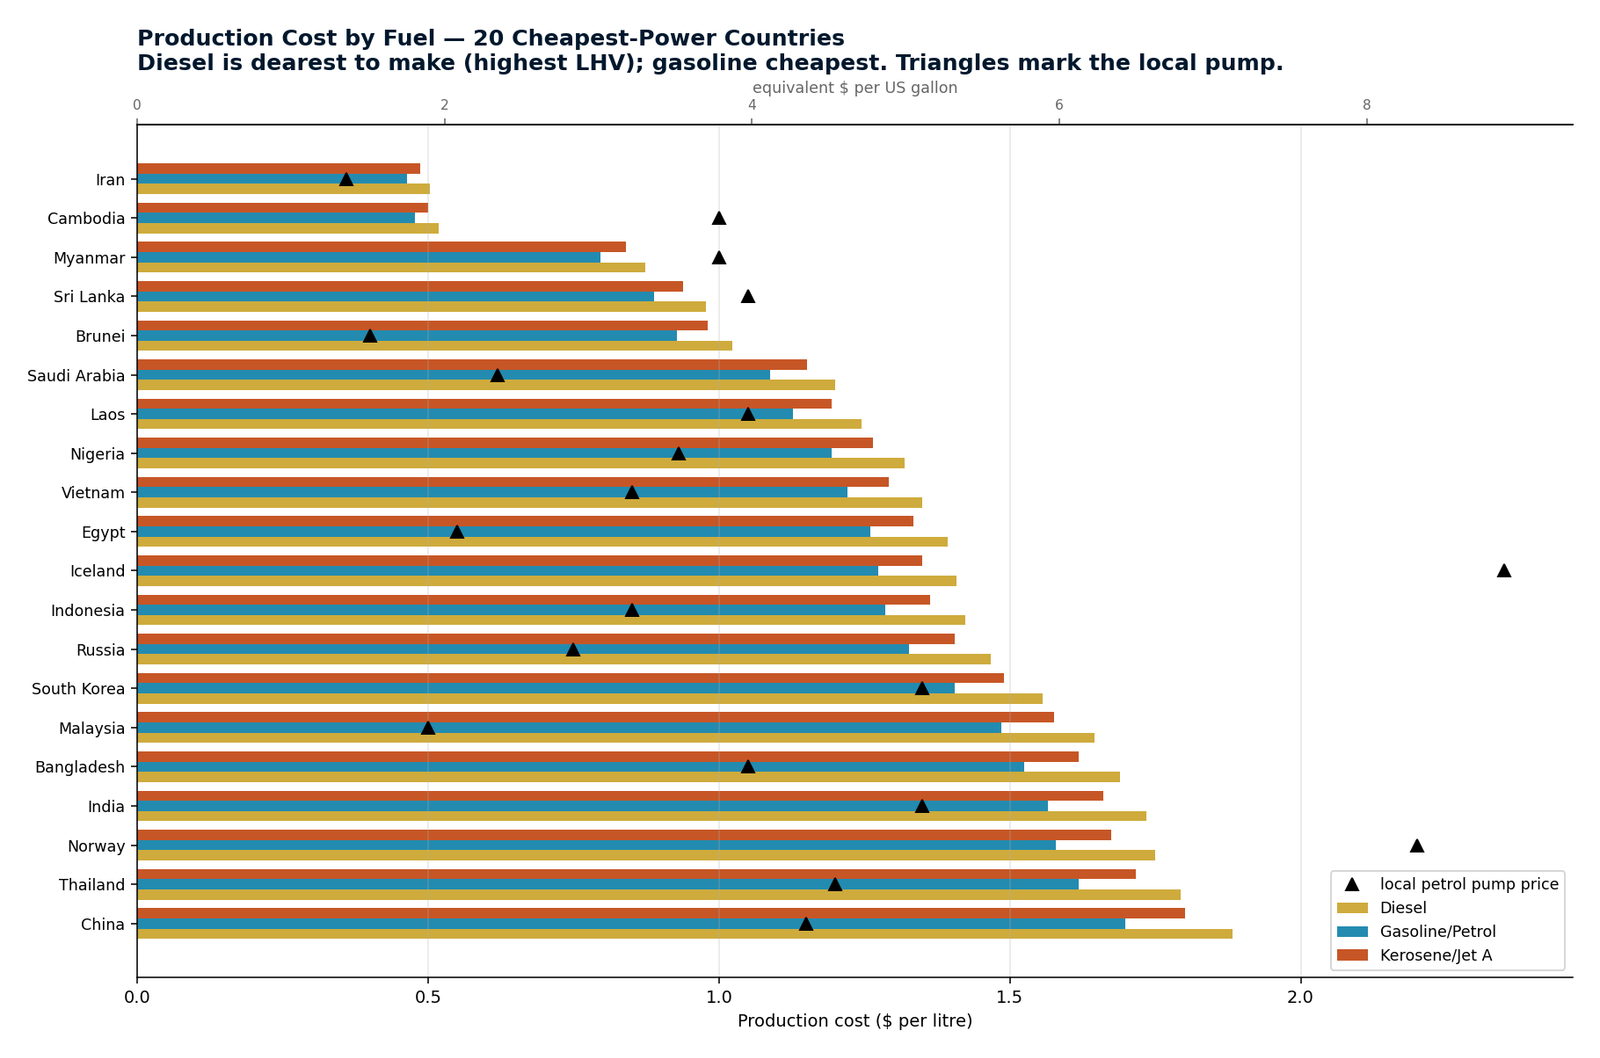
Diesel, gasoline and kerosene are not interchangeable. Each has its own energy content, so each carries a different electricity burden and a different carbon balance. Diesel costs the most to synthesise but sells at roughly an 18% premium — which more than covers the difference, making it the strongest open-market product. Kerosene's weak showing is a pricing artefact, not weak demand: Jet A1 is sold untaxed at wholesale, which is why Pillar 3 sells on mandate rather than price.
All three products at each site, with the local pump marked. Diesel viable in 11 of 68 countries, gasoline 8, kerosene 5.
CO₂ consumed and O₂ vented per unit produced. Diesel removes the most carbon per litre (2.626 kg/L, 9.94 kg/gal) — which is Pillar 4's basis.
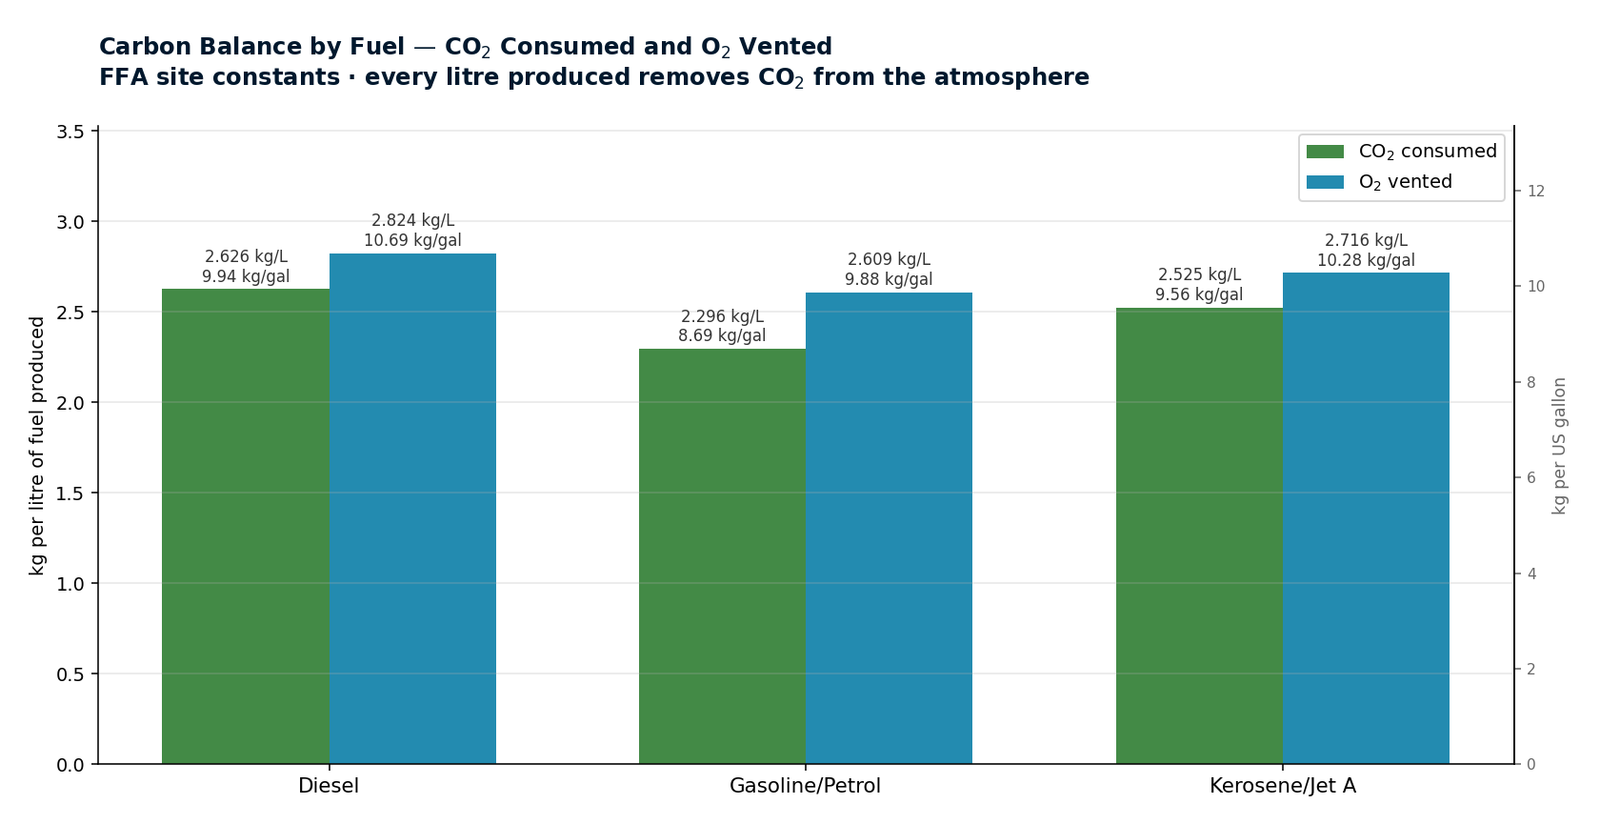
4 charts in this group. All figures in both litres and US gallons.
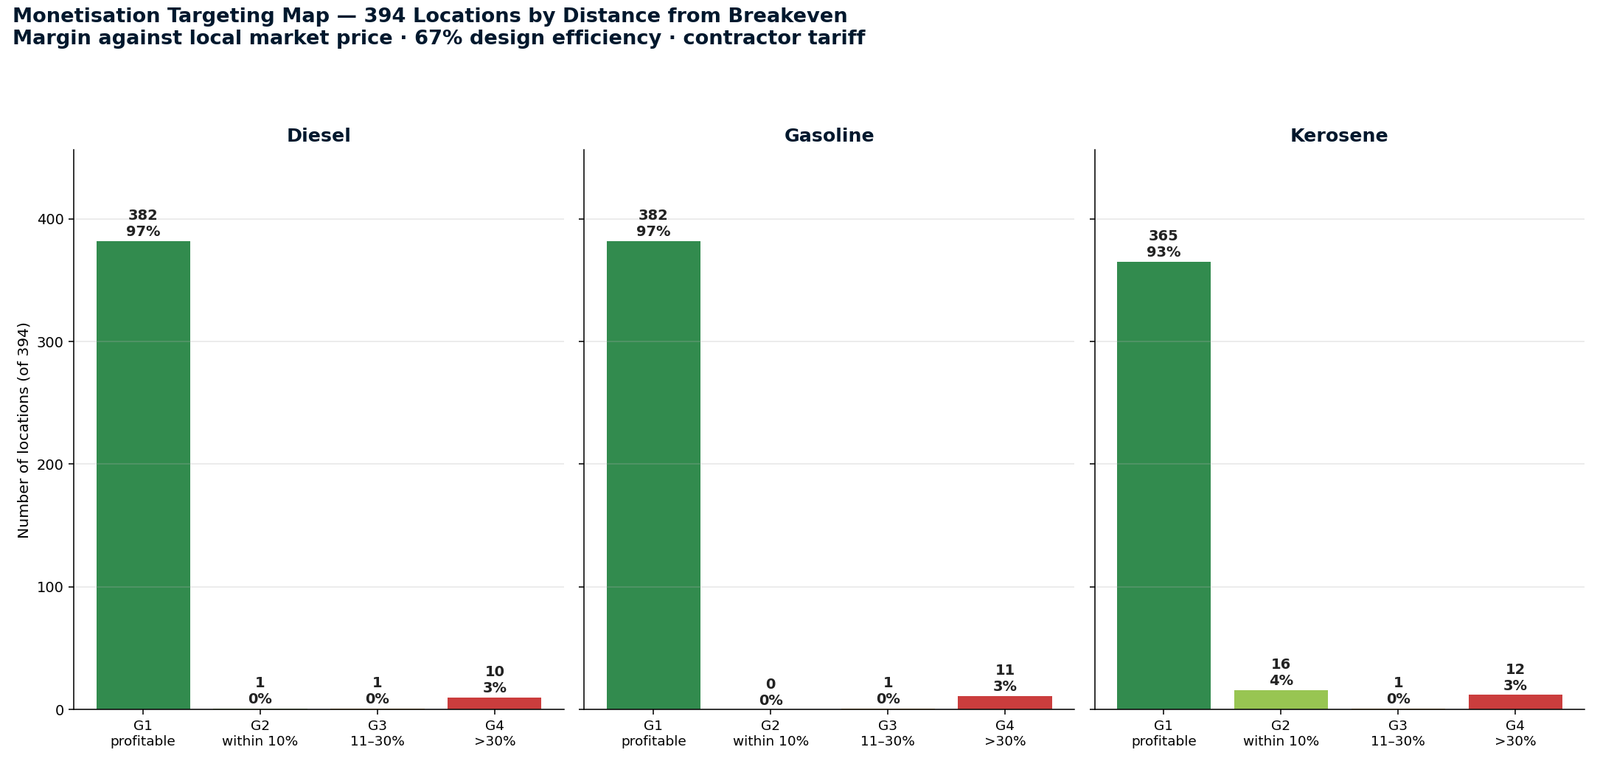
The original database is not 394 equal prospects. Grouping every site by its margin against the local market turns it into a sales sequence: Group 1 is approached with a price, Group 2 with a contract, Group 3 waits for mandate or supply-security pricing, and Group 4 is ranked rather than discarded so a tariff change moves a site up. The deep dive carries the finding that matters most — being in Group 1 is not the same as being investable.
All 394 original locations by distance from breakeven, per fuel. Diesel gives 73 profitable today plus 44 within 10% — 117 live or near-live targets.
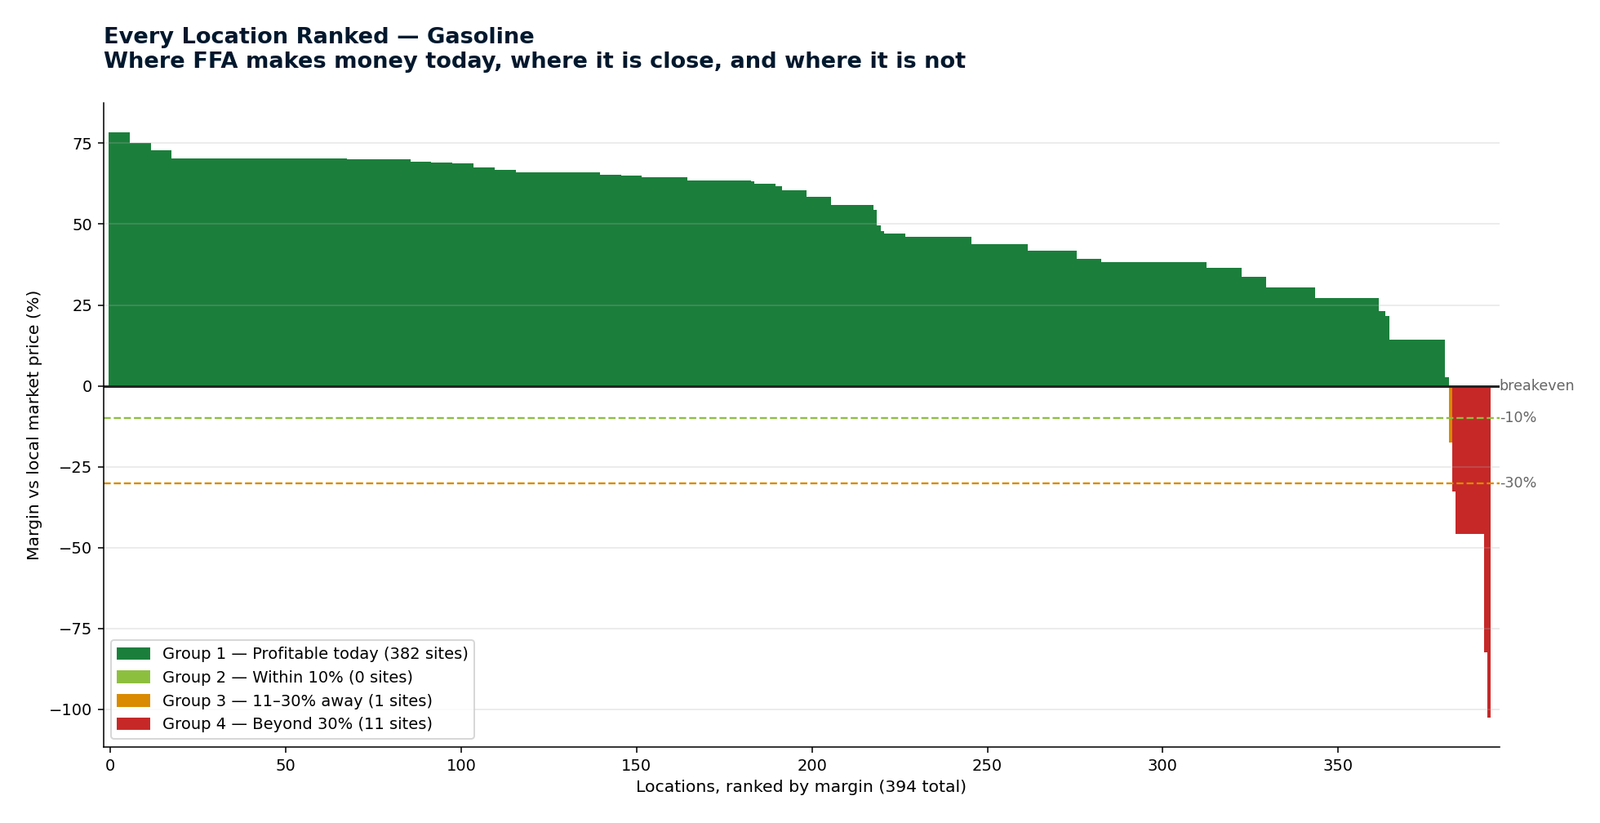
The full distribution for gasoline. 55 sites profitable, 48 within 10%, 45 within 30%, 246 beyond.
Ranked by payback rather than margin, the order changes completely. Cambodia has the best margin (56%) but Iceland pays back twice as fast, because Iceland clears on a $2.35/L pump rather than a cheap tariff.
3 charts in this group. All figures in both litres and US gallons.
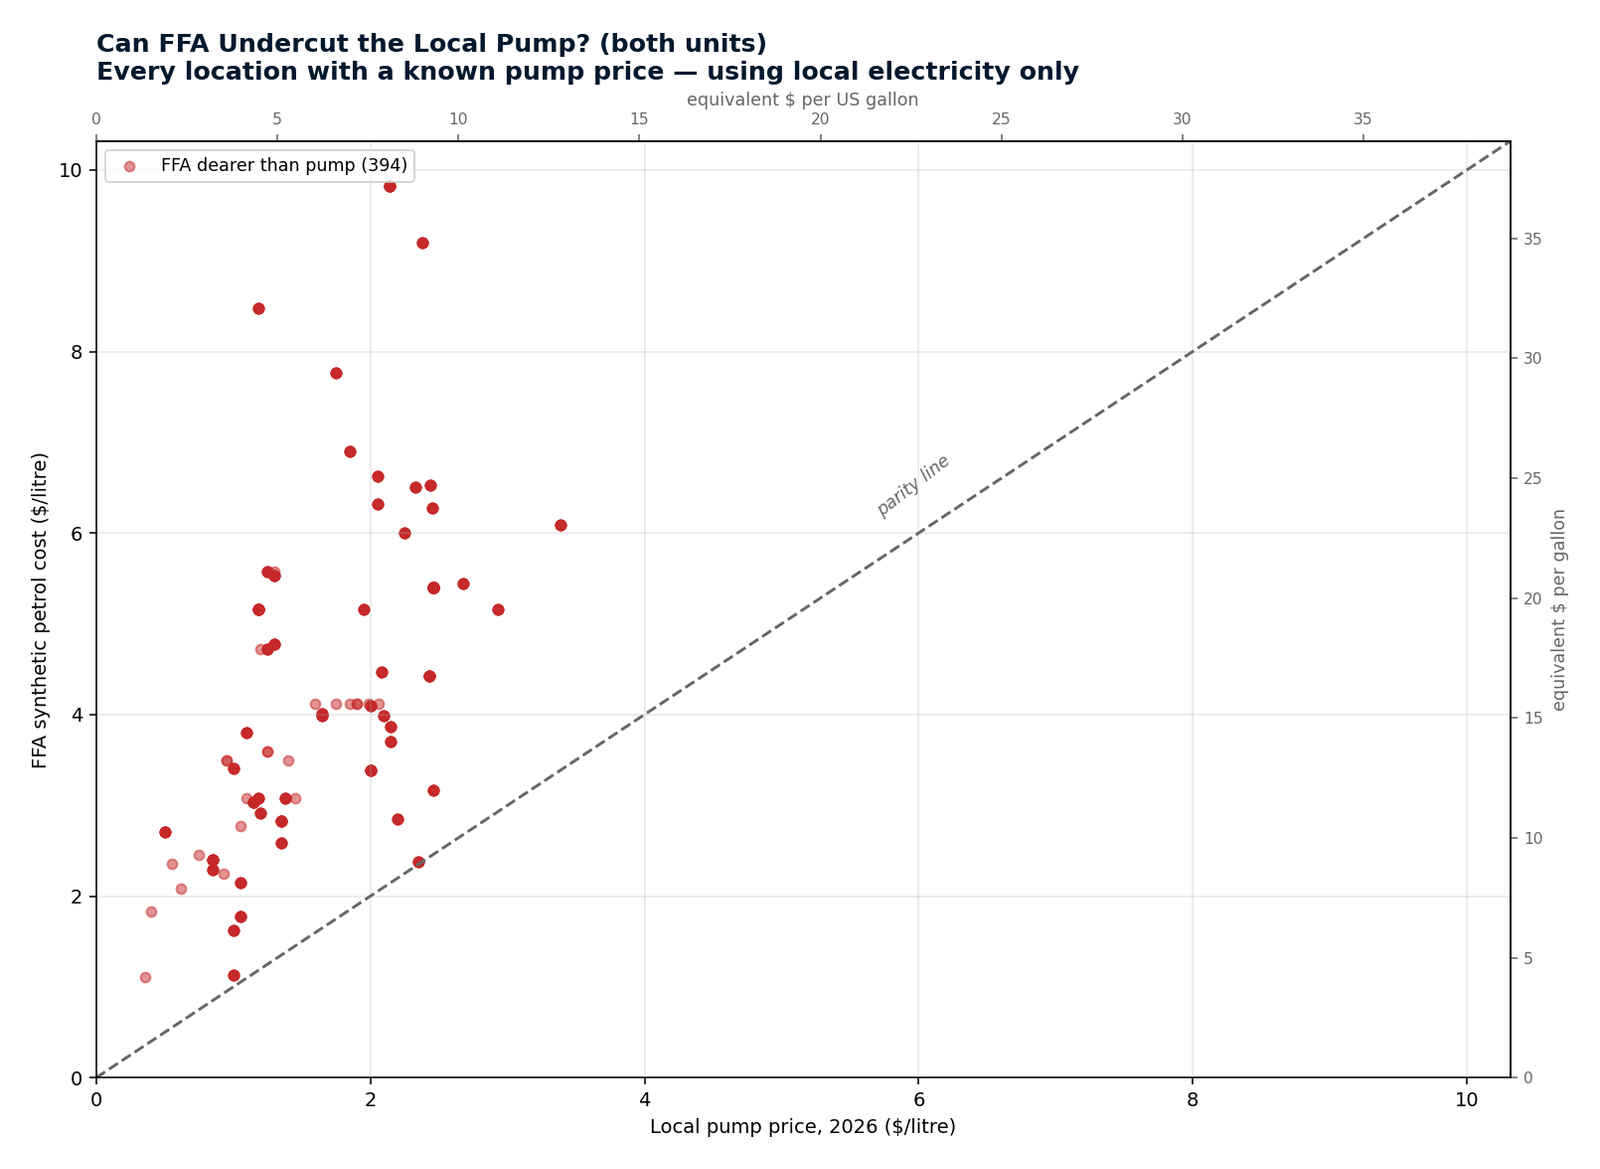
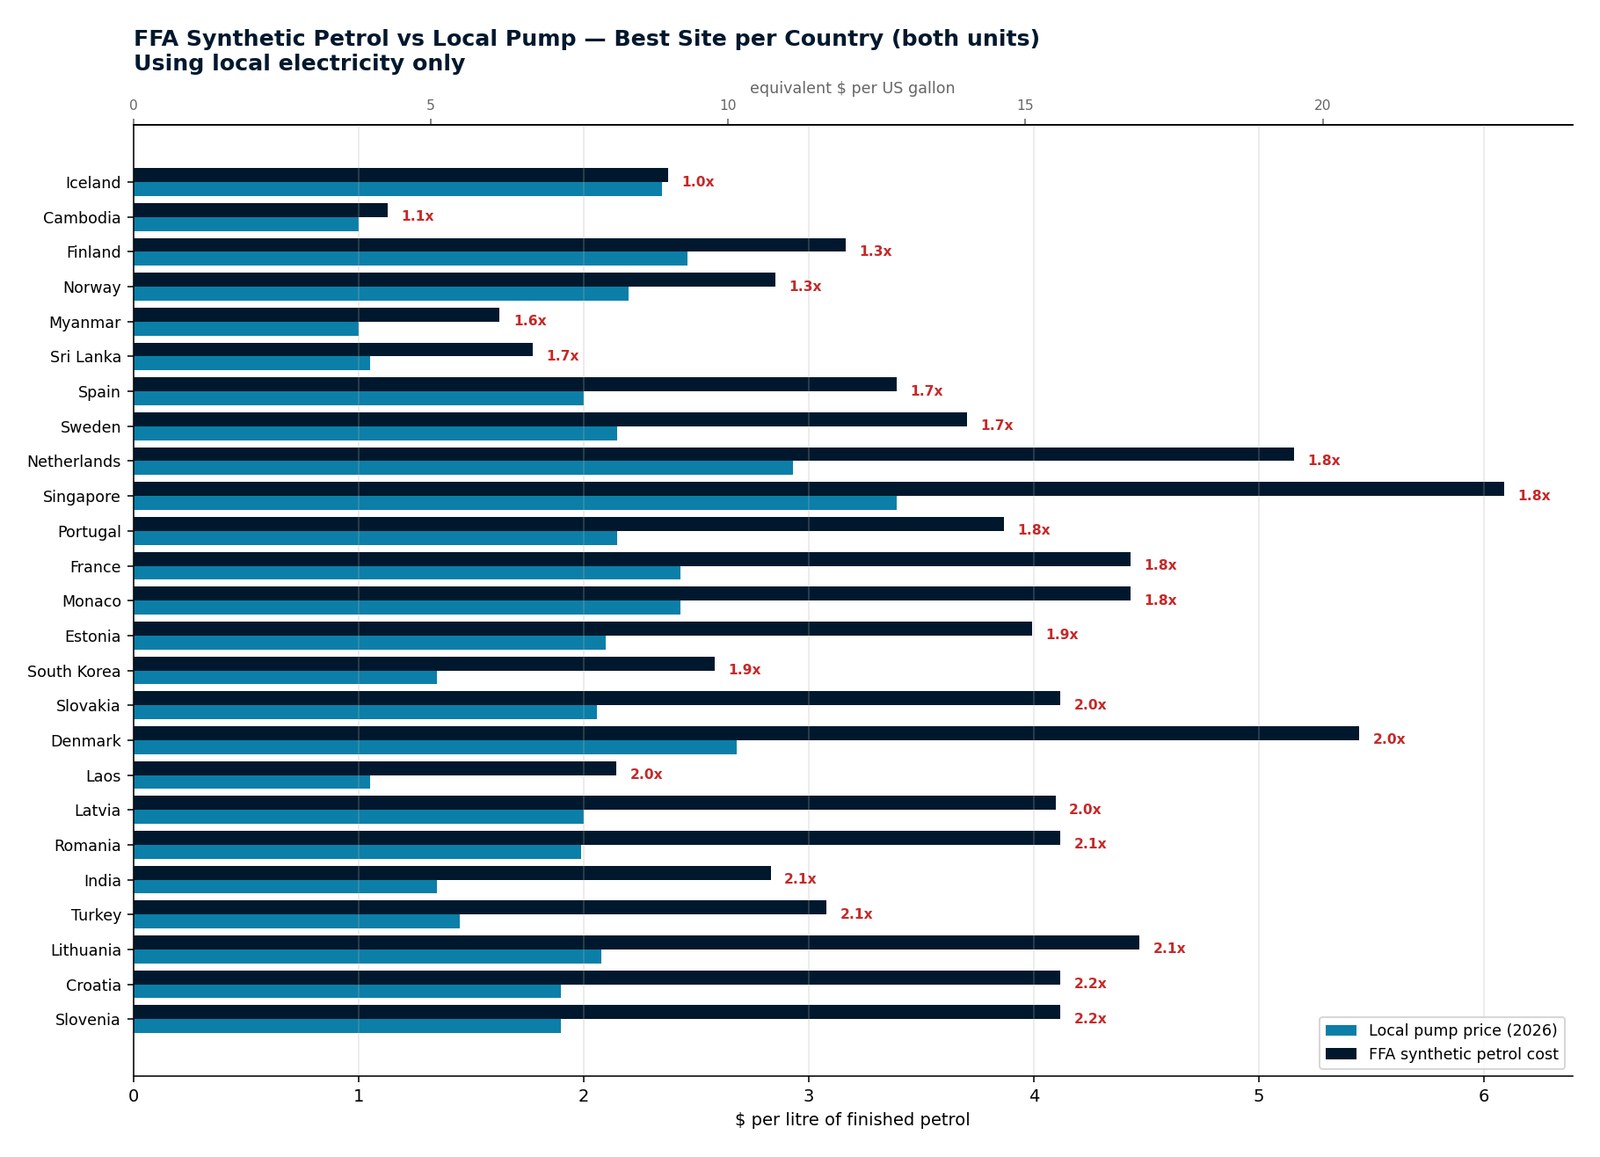
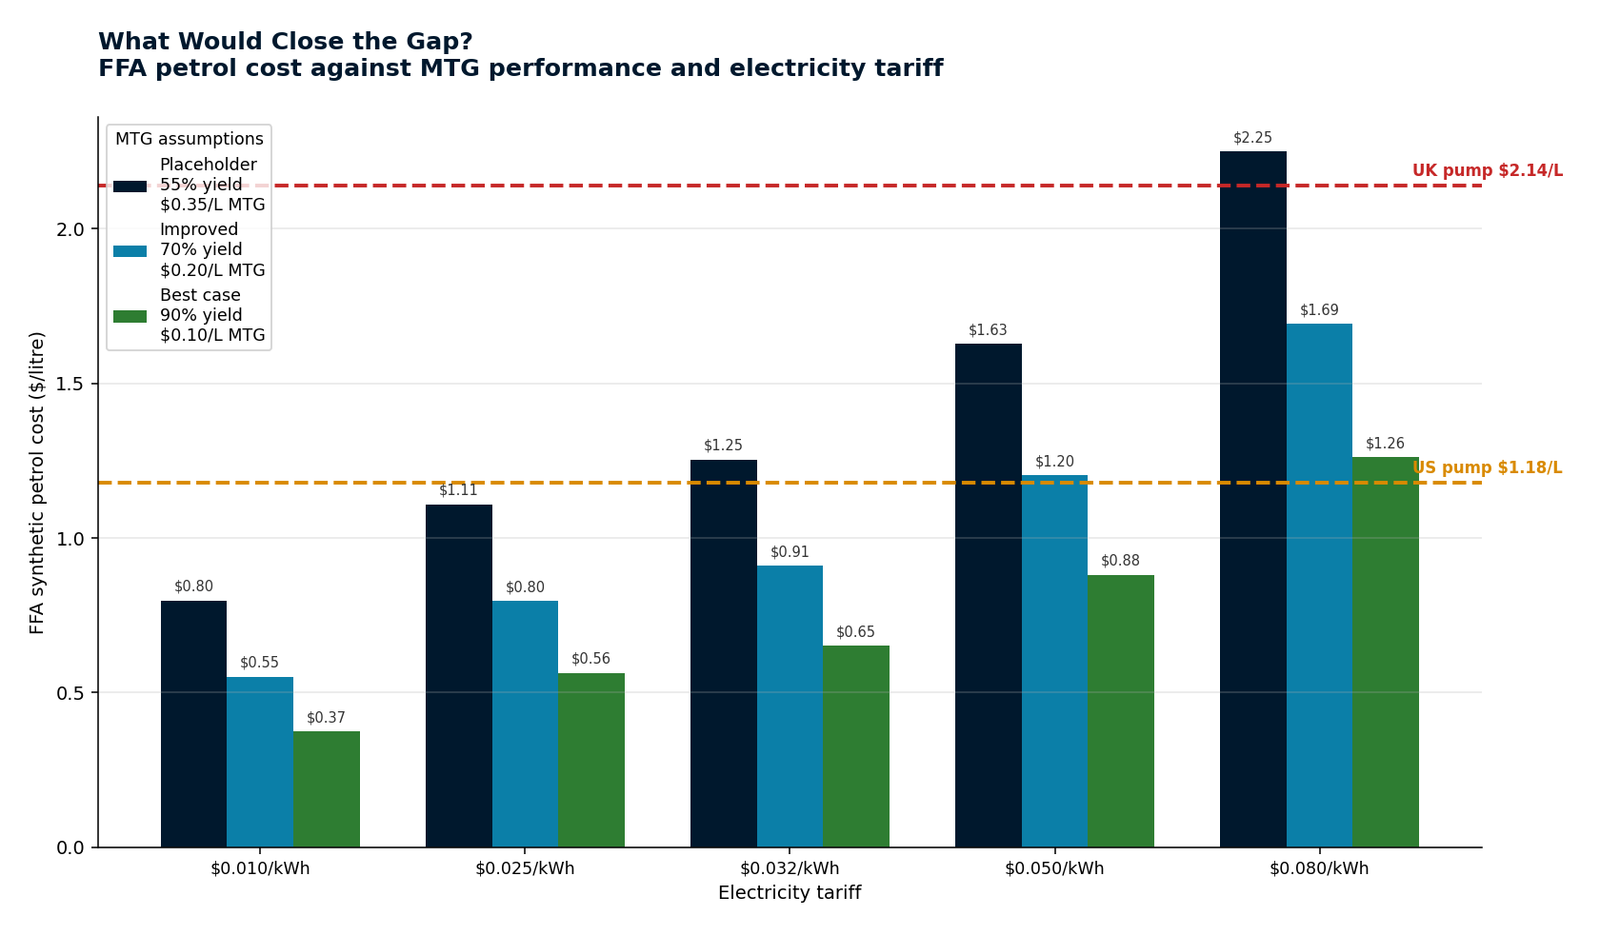
The plan's central commercial risk, stated plainly. On the current planning assumptions, FFA petrol does not undercut the local pump anywhere in the database. The mechanism is simple: the final conversion step loses volume and adds cost, and the result competes against refined crude produced at enormous scale. Improving MTG performance narrows the gap materially but does not, on this modelling, close it against unsubsidised crude.
Every location with a known pump price. Every point sits above the parity line.
Best site per country. The ratio label shows how far short each falls.
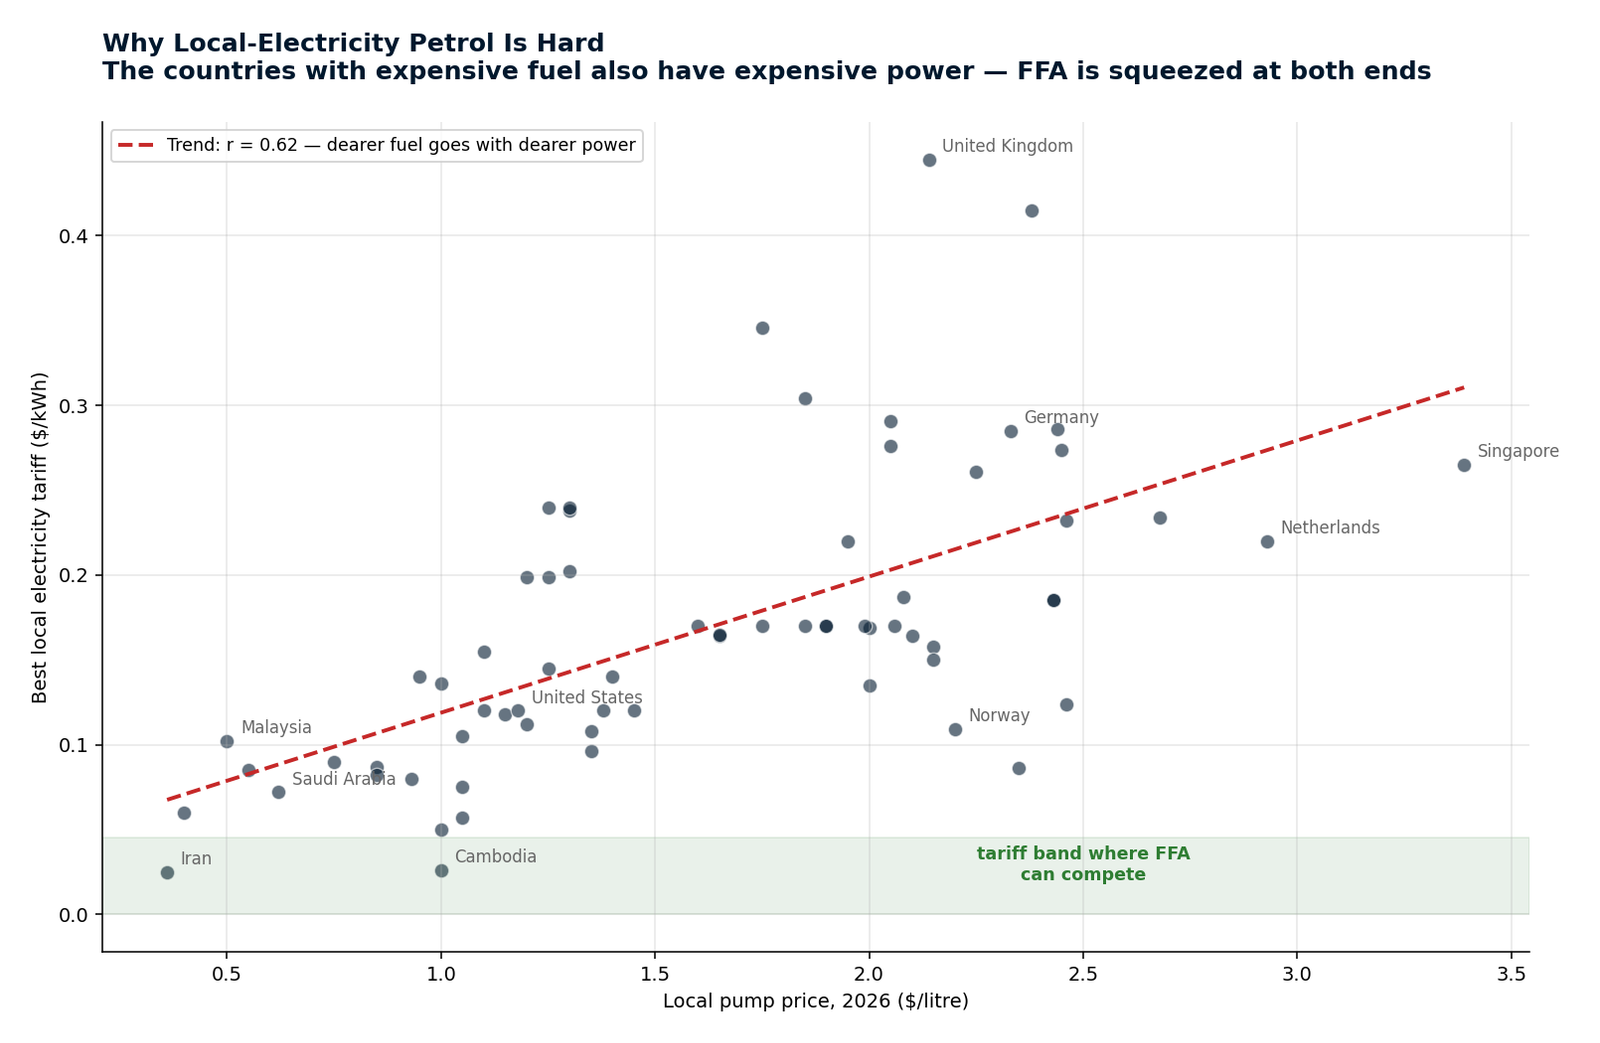
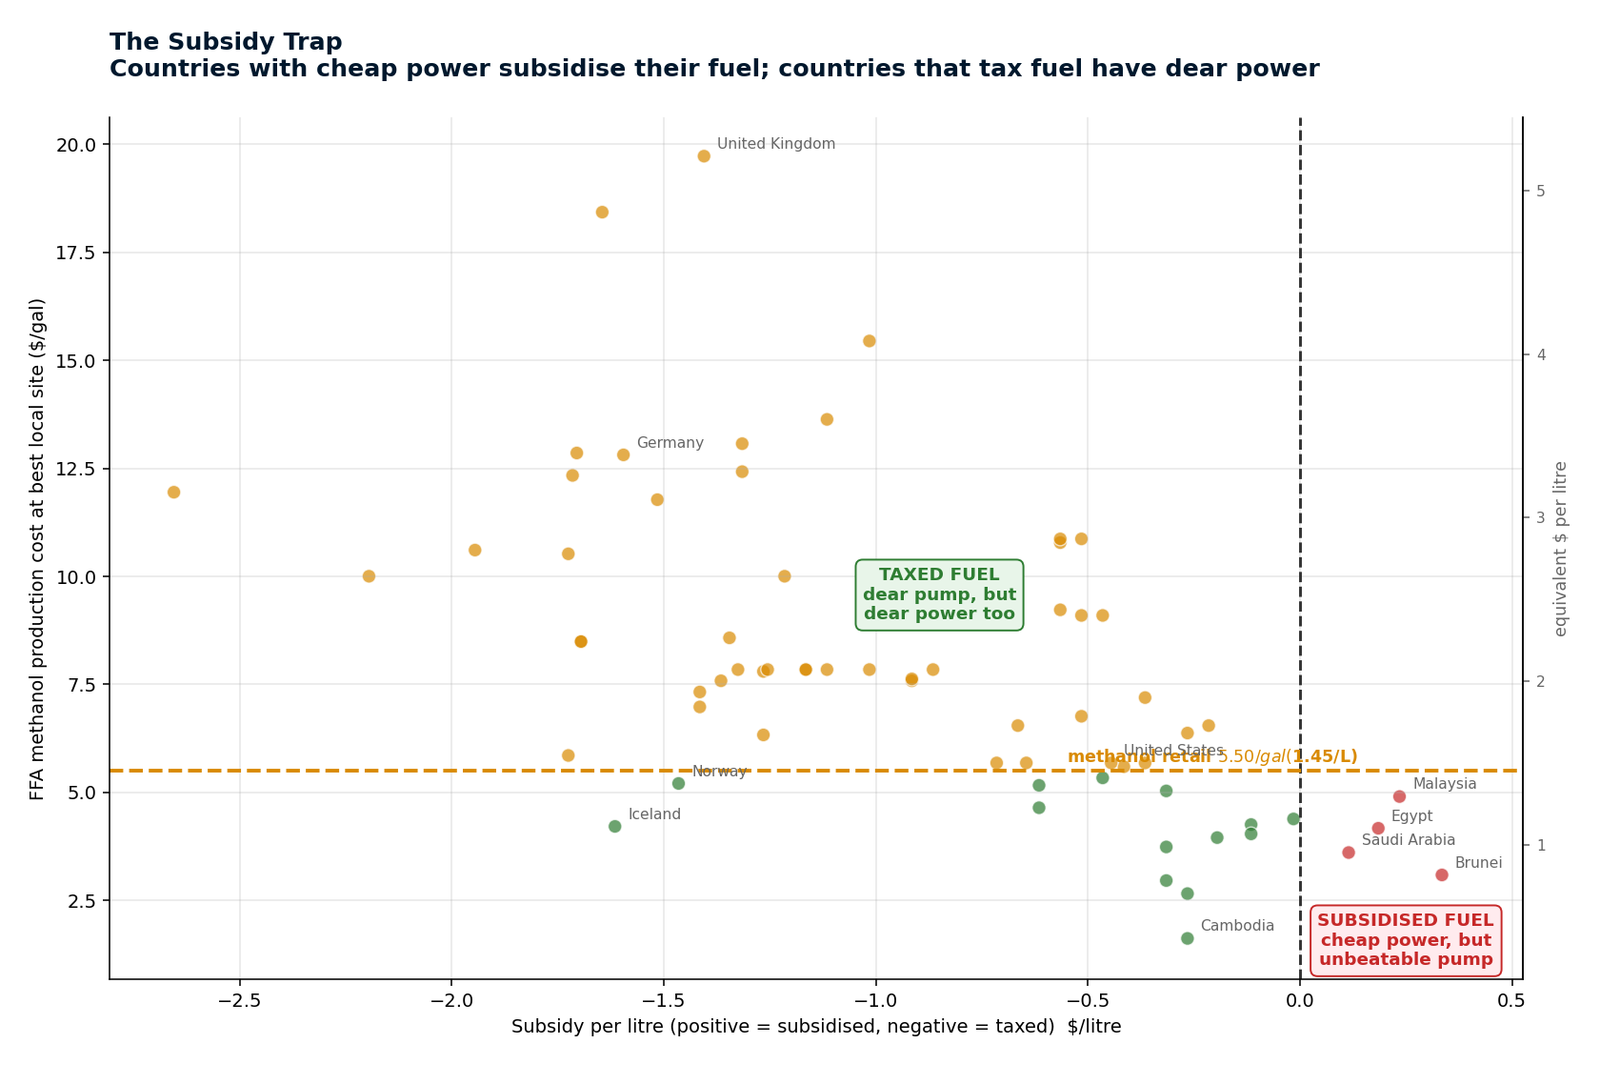
The mechanism: pump price and electricity price correlate at r = 0.62. Where fuel is worth replacing, power is dear; where power is cheap, fuel is cheaper still.
At 90% yield and $0.10/L conversion, gasoline falls to $0.65/L — below the US pump. The route is unproven rather than hopeless.
How cheap power must be for FFA to match the pump at each price level.
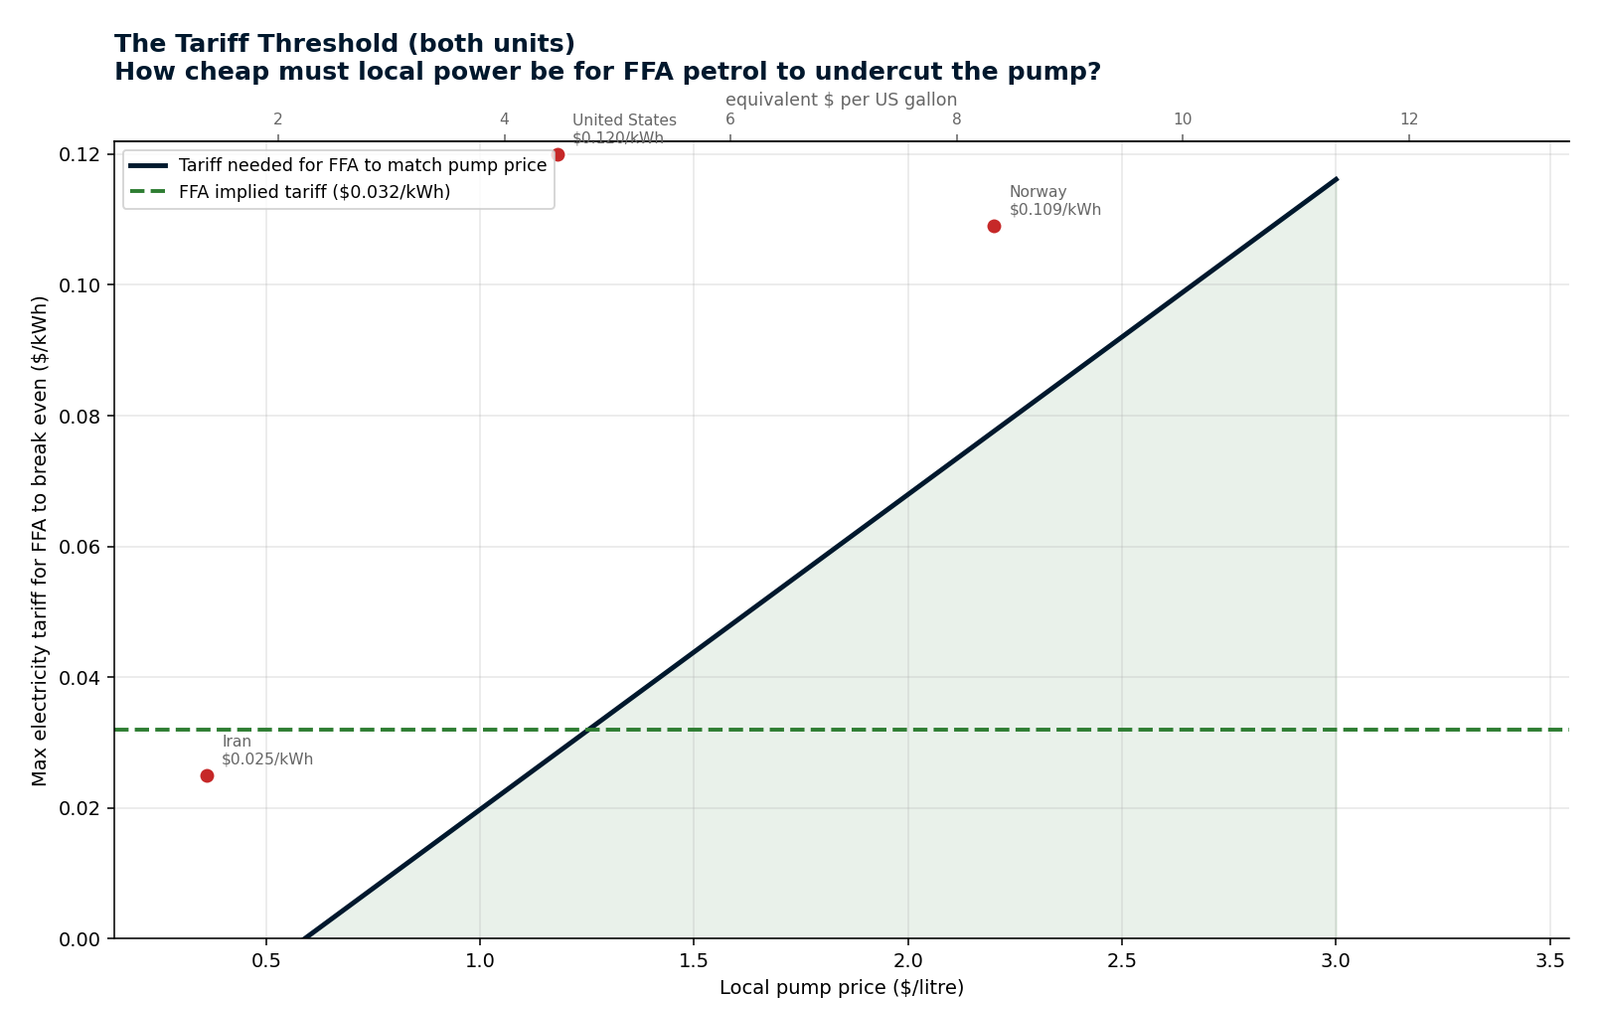
5 charts in this group. All figures in both litres and US gallons.
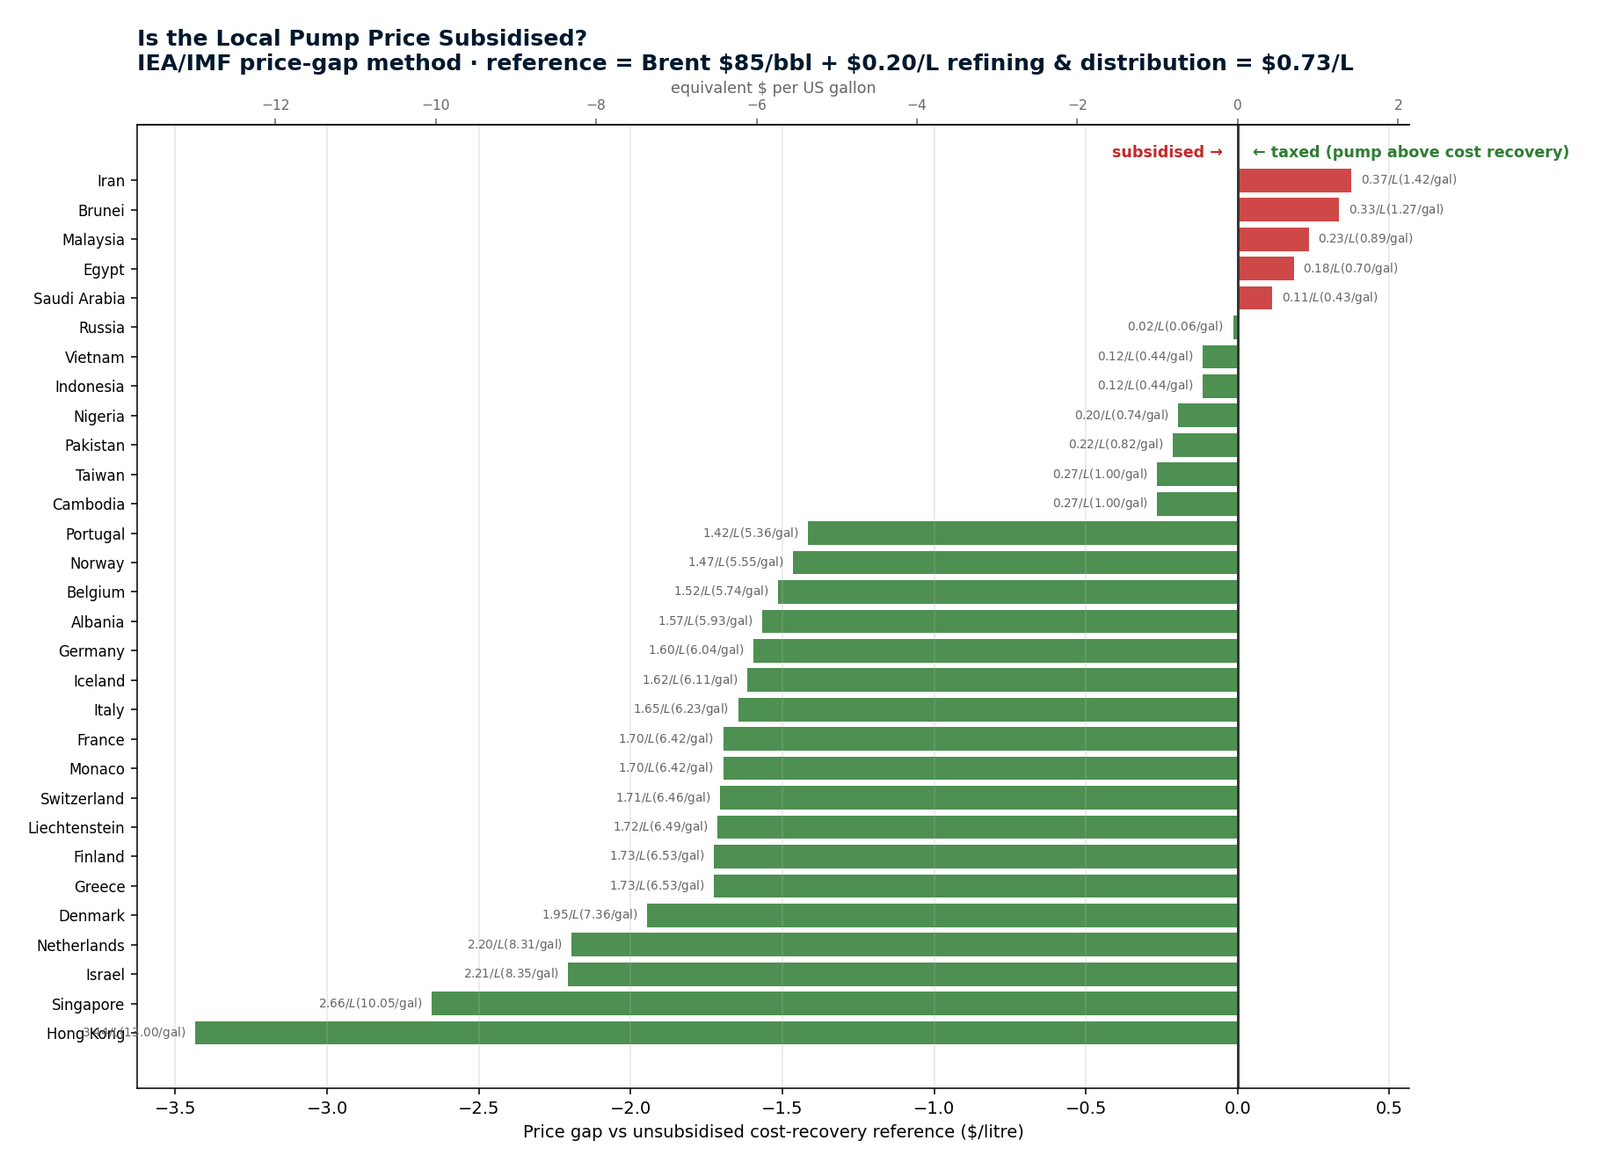
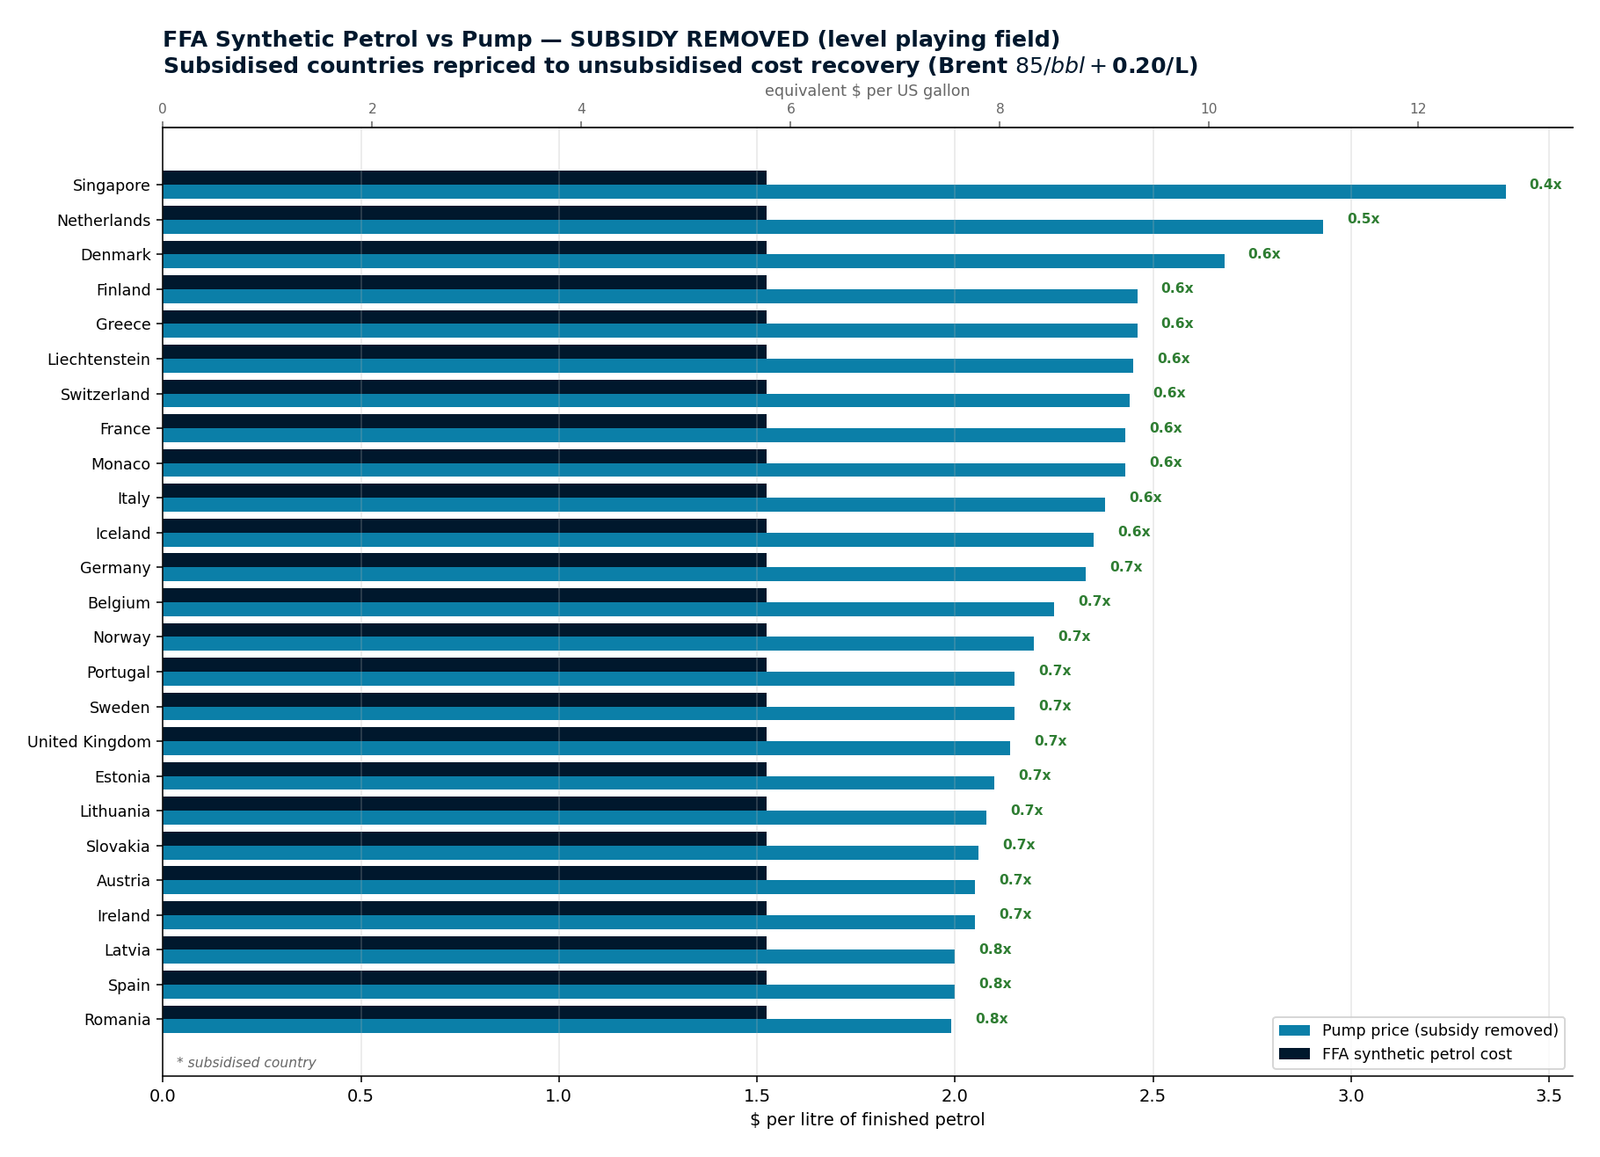
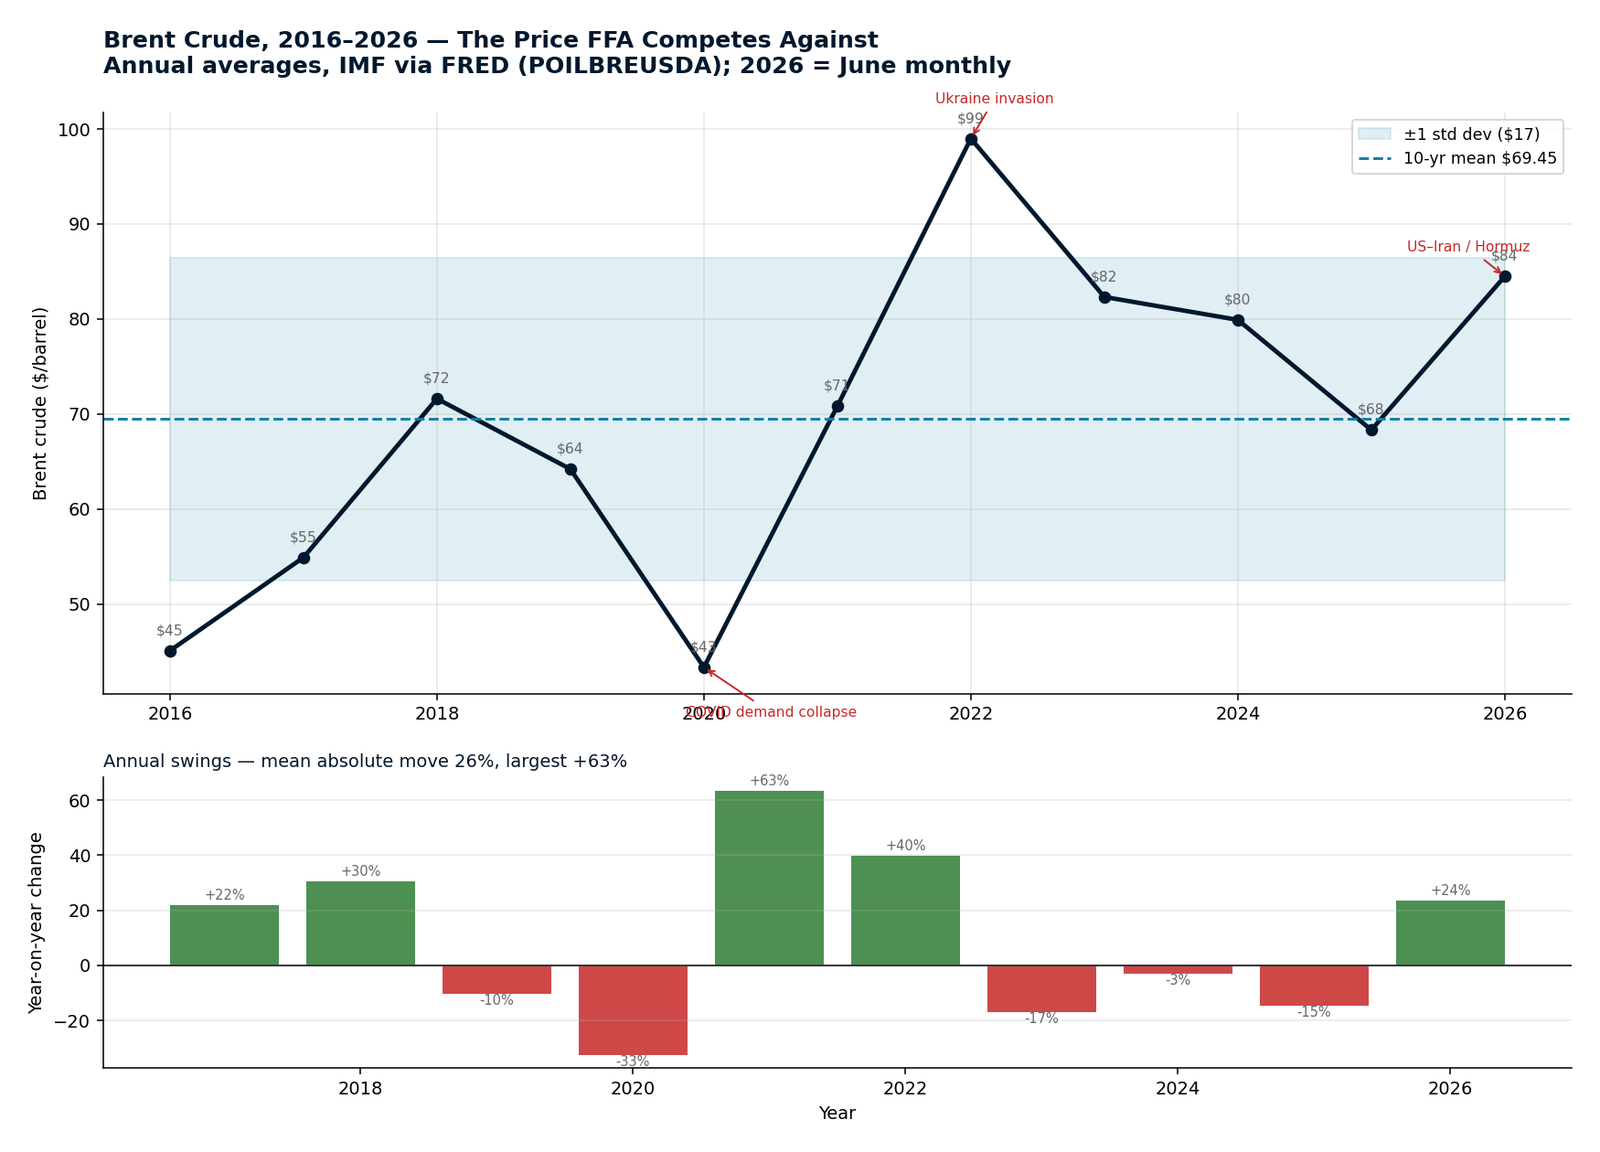
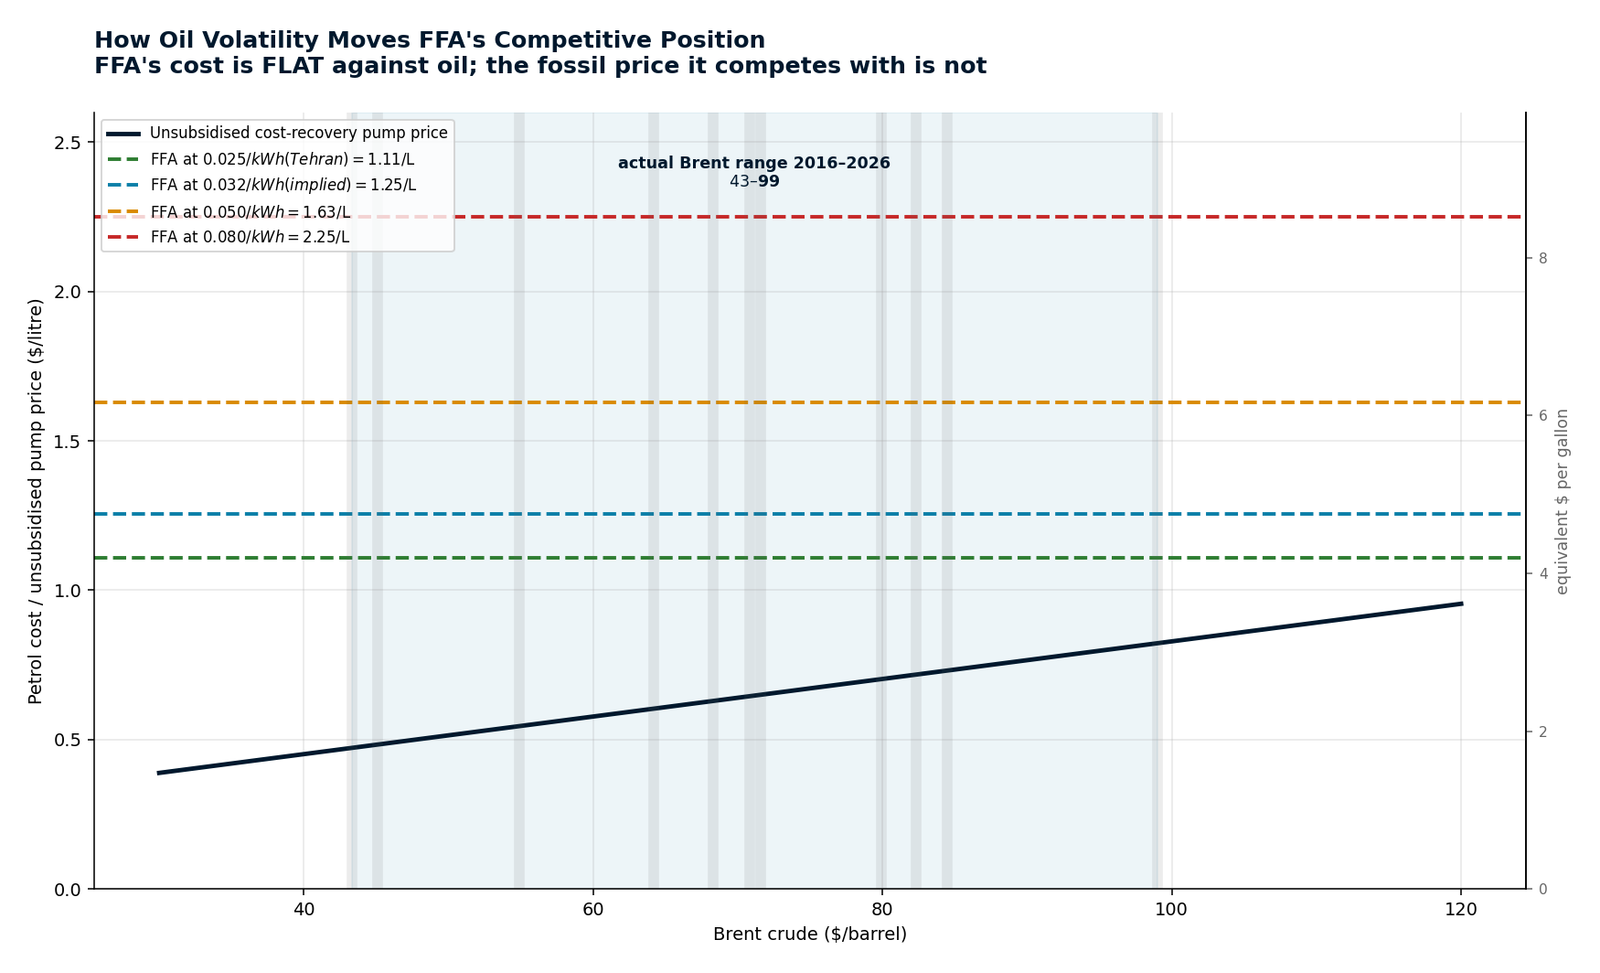
Two common defences examined and, in one case, dismissed. Subsidy is not the barrier: only 5 of 68 countries price petrol below cost recovery, and removing their subsidy entirely changes nothing. Oil volatility is real — Brent averaged $69.45 over the decade with a 24.5% coefficient of variation — and it works in FFA's favour, since a plant's cost is flat against crude. But the gap is structural, not cyclical: even the largest supply disruption in the history of the oil market did not close it.
IEA/IMF price-gap method. Only Iran, Brunei, Malaysia, Egypt and Saudi Arabia price below cost recovery. The other 63 tax fuel above it.
The single chart that explains the problem. Cheap-power countries subsidise their fuel; fuel-taxing countries have dear power. FFA is squeezed at both ends — but 14 of its 19 viable countries are not subsidised.
Actual 2026 pump prices, including government subsidy where it exists.
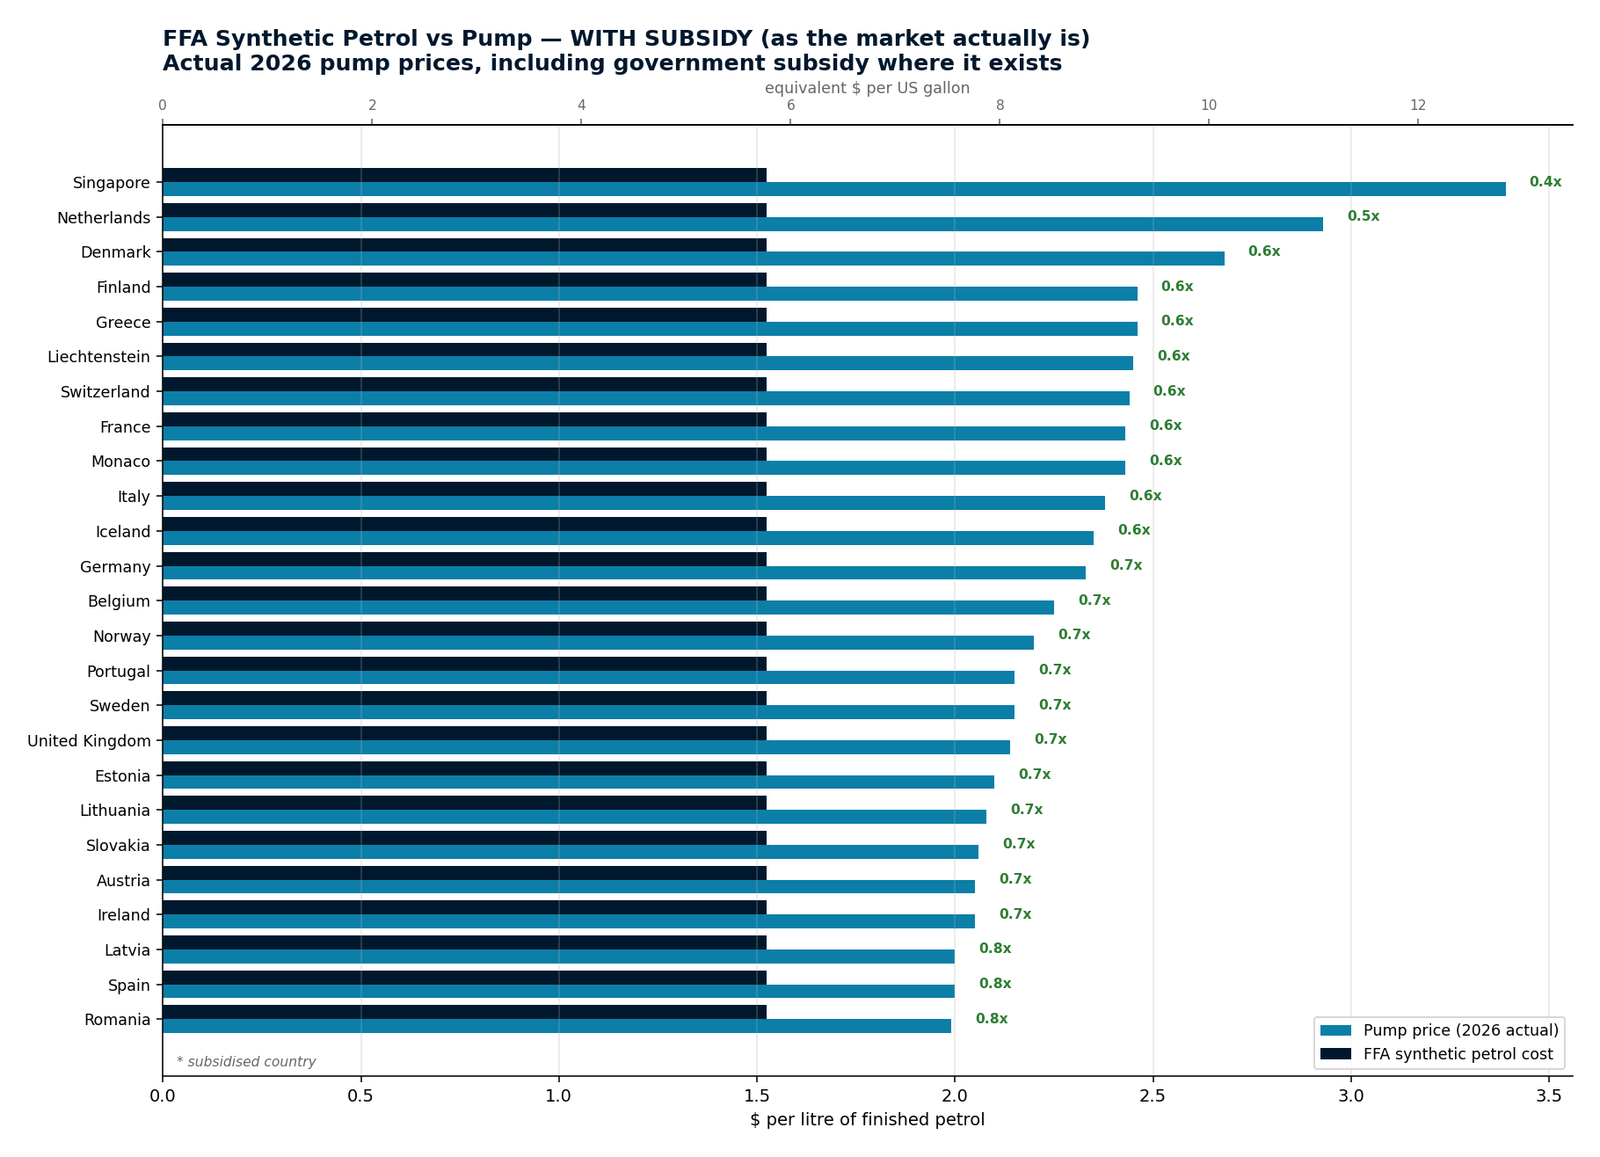
Subsidised countries repriced to cost recovery. The result barely moves: 65 of 68 with subsidy, 67 without — removing subsidy changes almost nothing.
Mean $69.45, standard deviation $17.02, high 2.3x the low. Mean absolute annual move 26%.
FFA's cost is flat against oil, so volatility is pure upside optionality. But petrol needs Brent at $168 — 70% above the highest annual average ever recorded.
The Strait of Hormuz closure: 14 mb/d shut in, supply down to 94.5 mb/d, OECD stocks at their lowest since 1990.
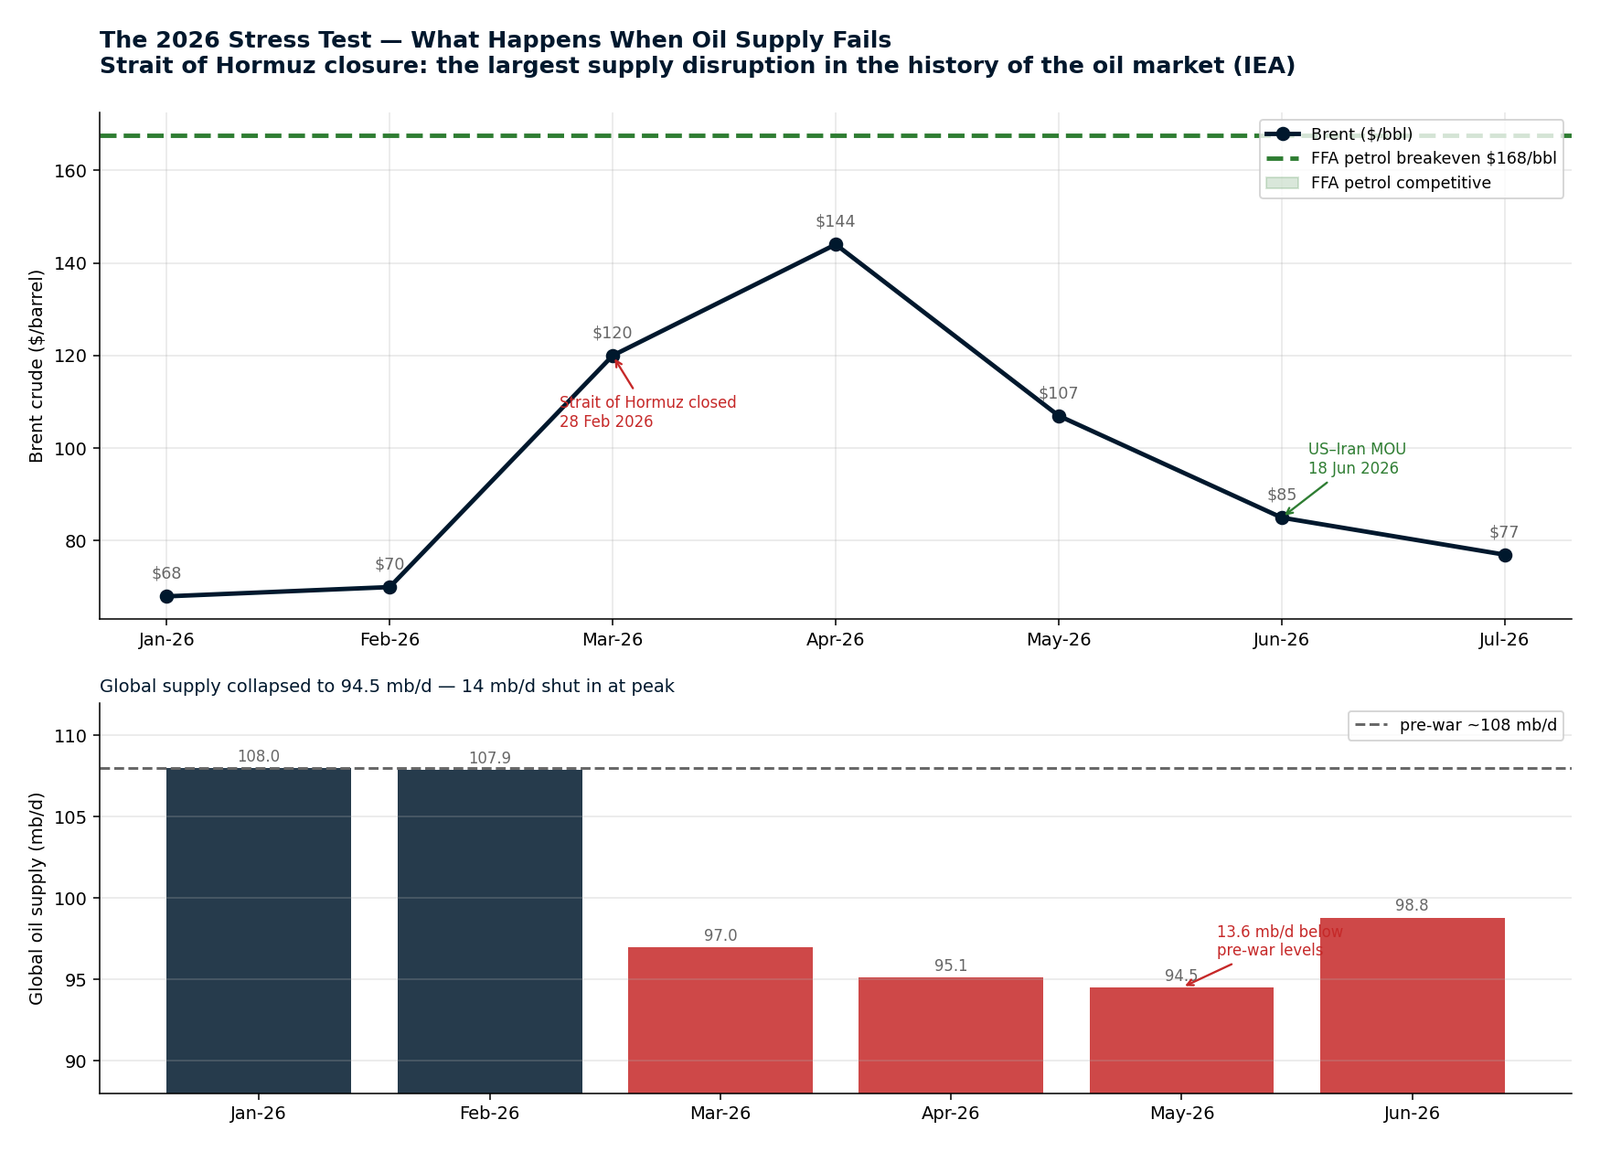
Through a doubling and halving of Brent, FFA held at $1.25/L. At the $144 April peak fossil reached $1.11/L — still short. The worst crisis on record got fossil to 86% of breakeven and no further.
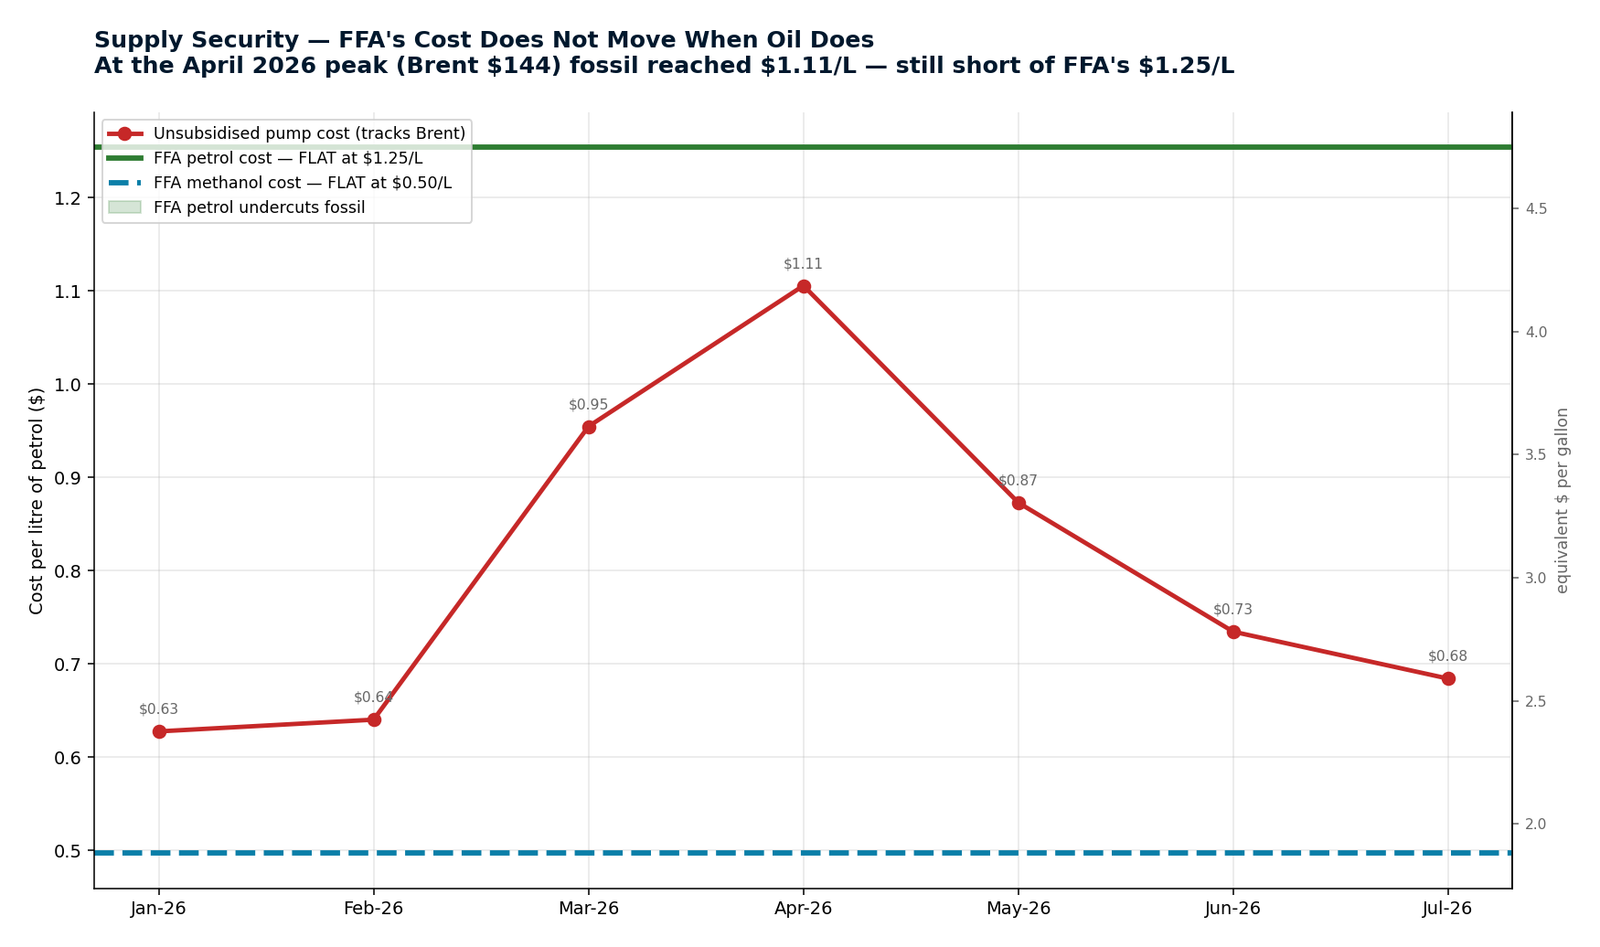
8 charts in this group. All figures in both litres and US gallons.
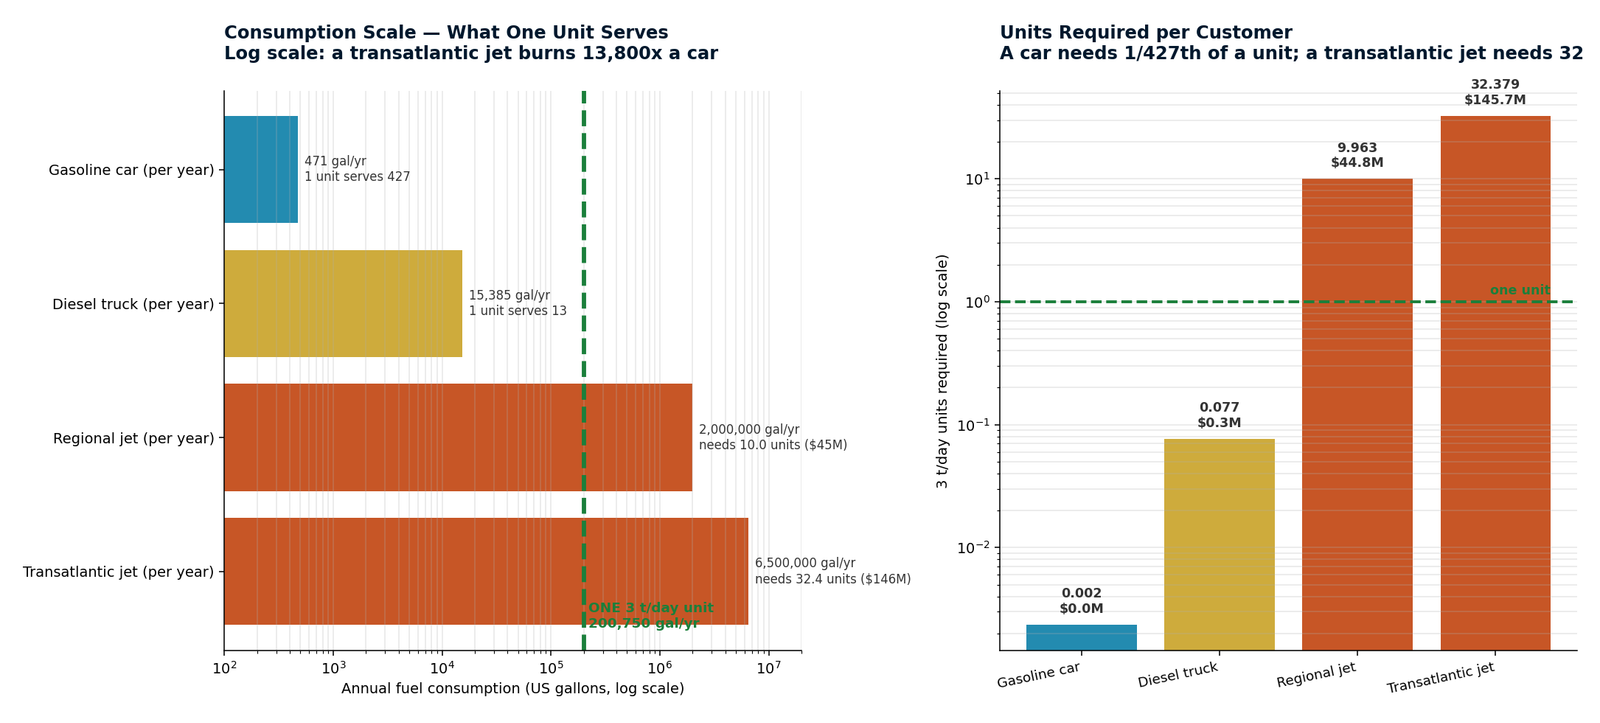
How the pillars reach a buyer, and at what scale. The three anchors are a sequence rather than a choice: supply security funds early units at high margin without competing on price, mandate scales under regulatory cover, and the open market is the volume endgame. The scale charts carry the honest counterweight — a 3 t/day unit produces about 13 barrels a day, so FFA can address small markets or well-chosen niches inside large ones, but not large markets at a ten-percent share.
Annual EBITDA per $4.5M unit. Same plant, same cost base; only the customer and the pricing basis change. Petrol on the open market is the only losing case.
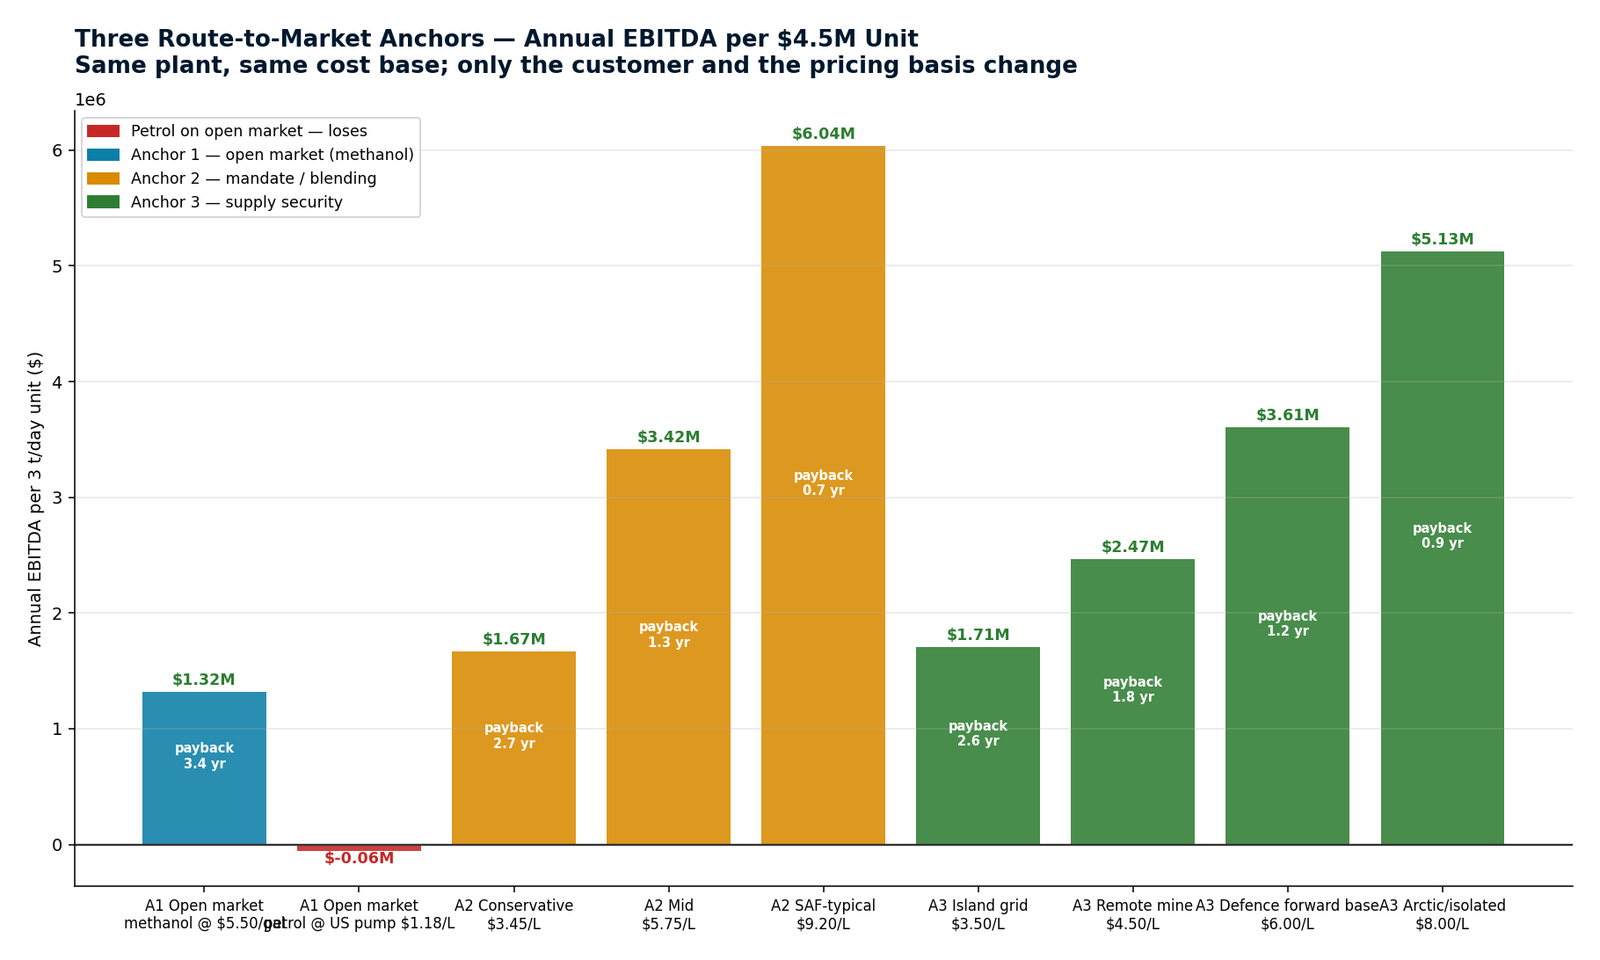
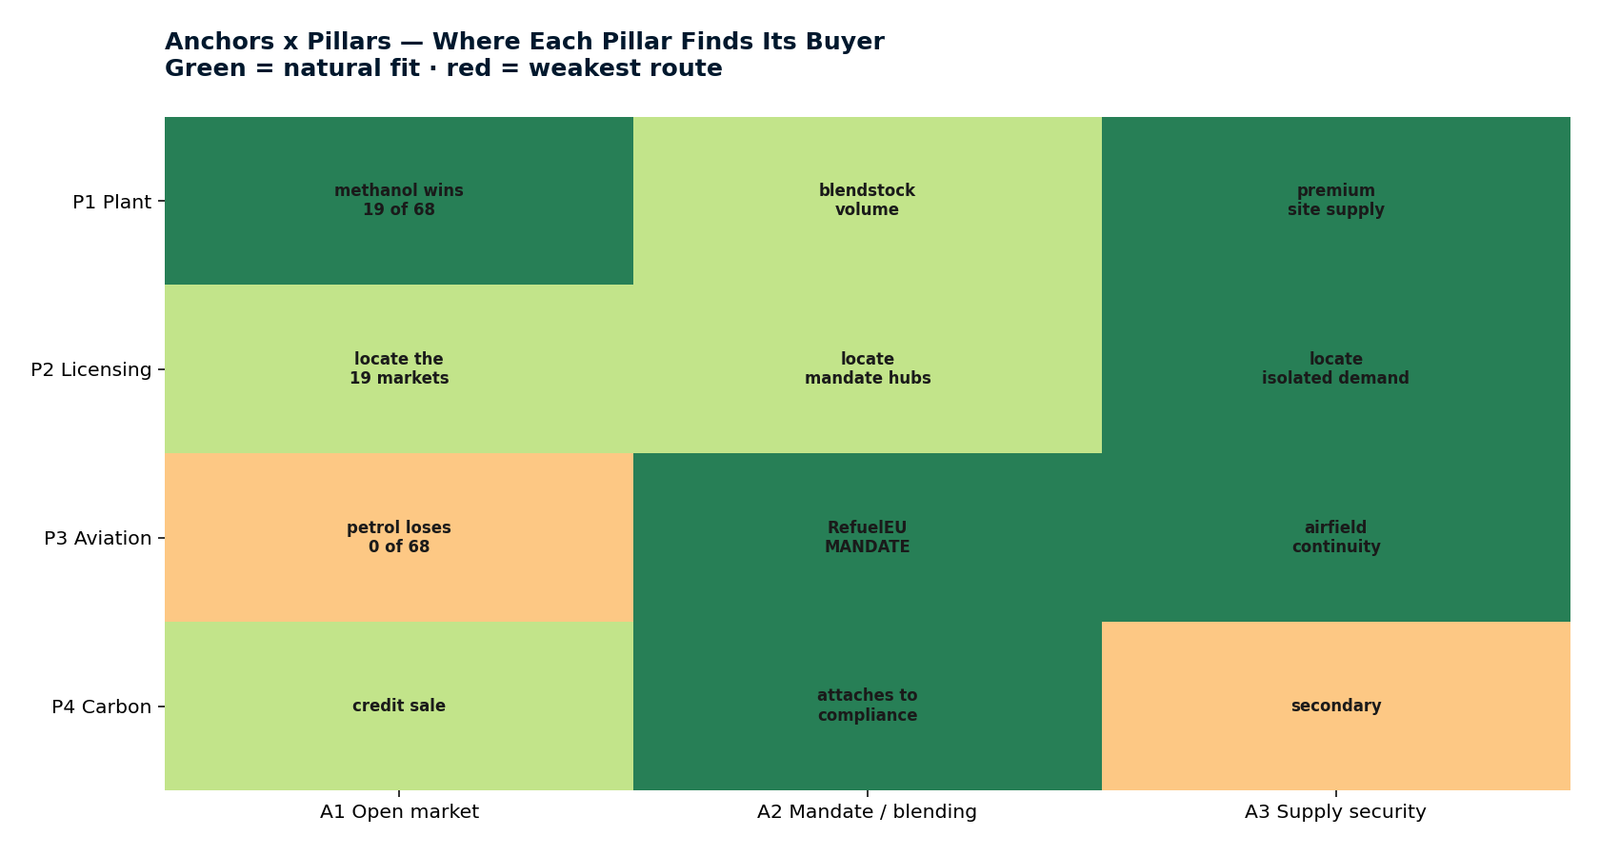
P3 Aviation on Anchor 1 is the single red cell — and precisely the case the pump analysis dissects. P3 survives because Anchor 2 is its route.
One unit serves 427 cars or 13 trucks; a regional jet needs 10 units, a transatlantic jet 32.
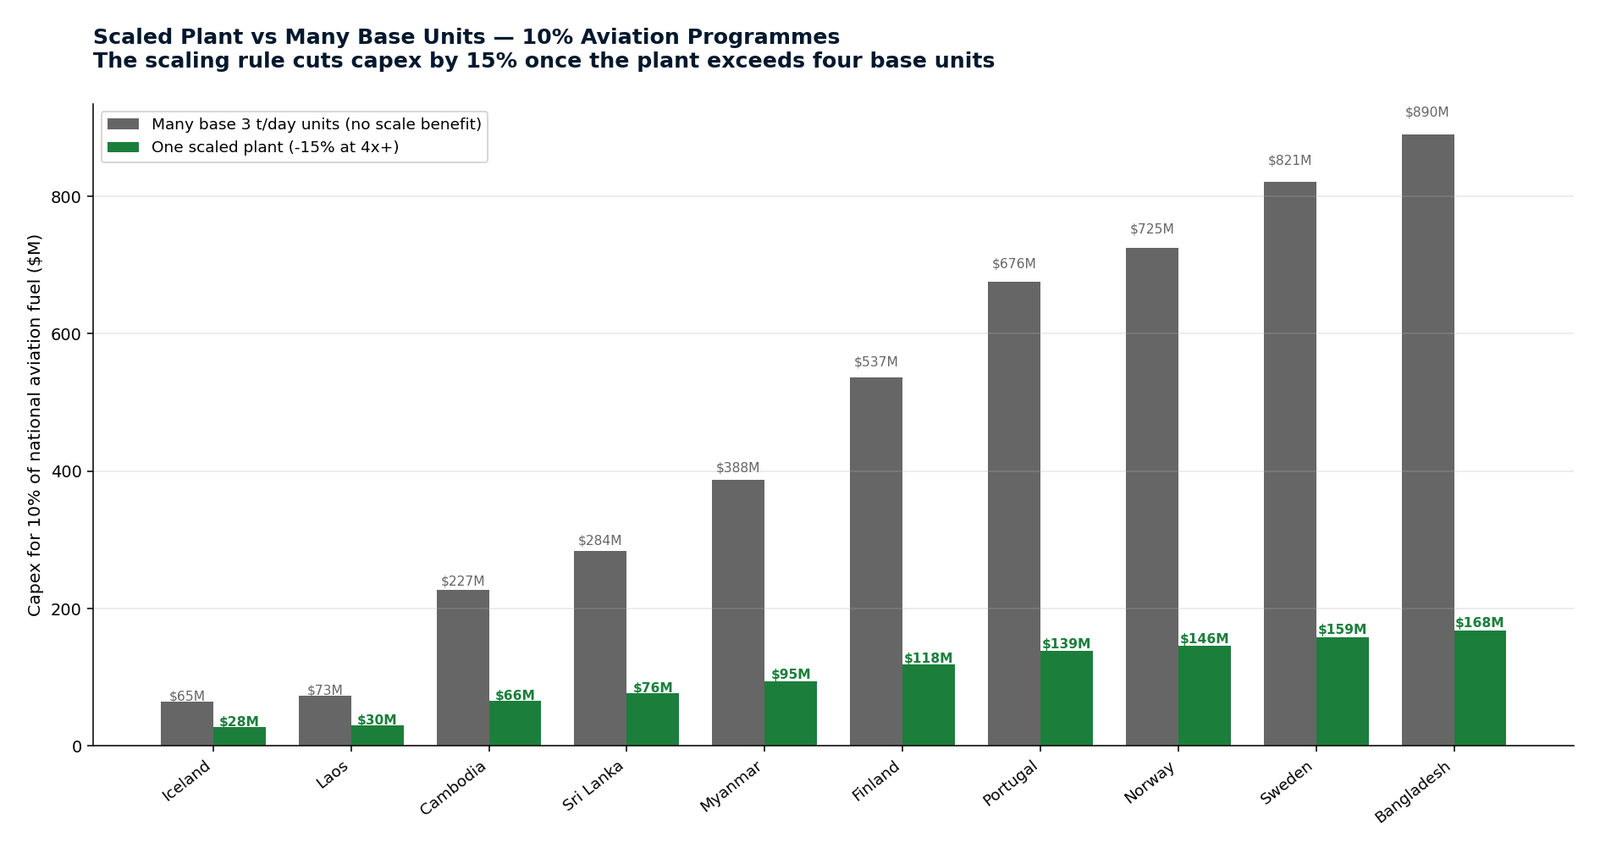
Units and capital to supply a tenth of each country's demand, road against aviation.
Iceland's aviation sector: 14 units, $64.9M. The only ten-percent target in the database under $100M.
Even the largest FFA unit supplies under a hundredth of a percent. Scale is the constraint, not cost.
Linear output with a capped cost reduction; consistent with FFA's own note on minimal economies beyond 3 t/day.
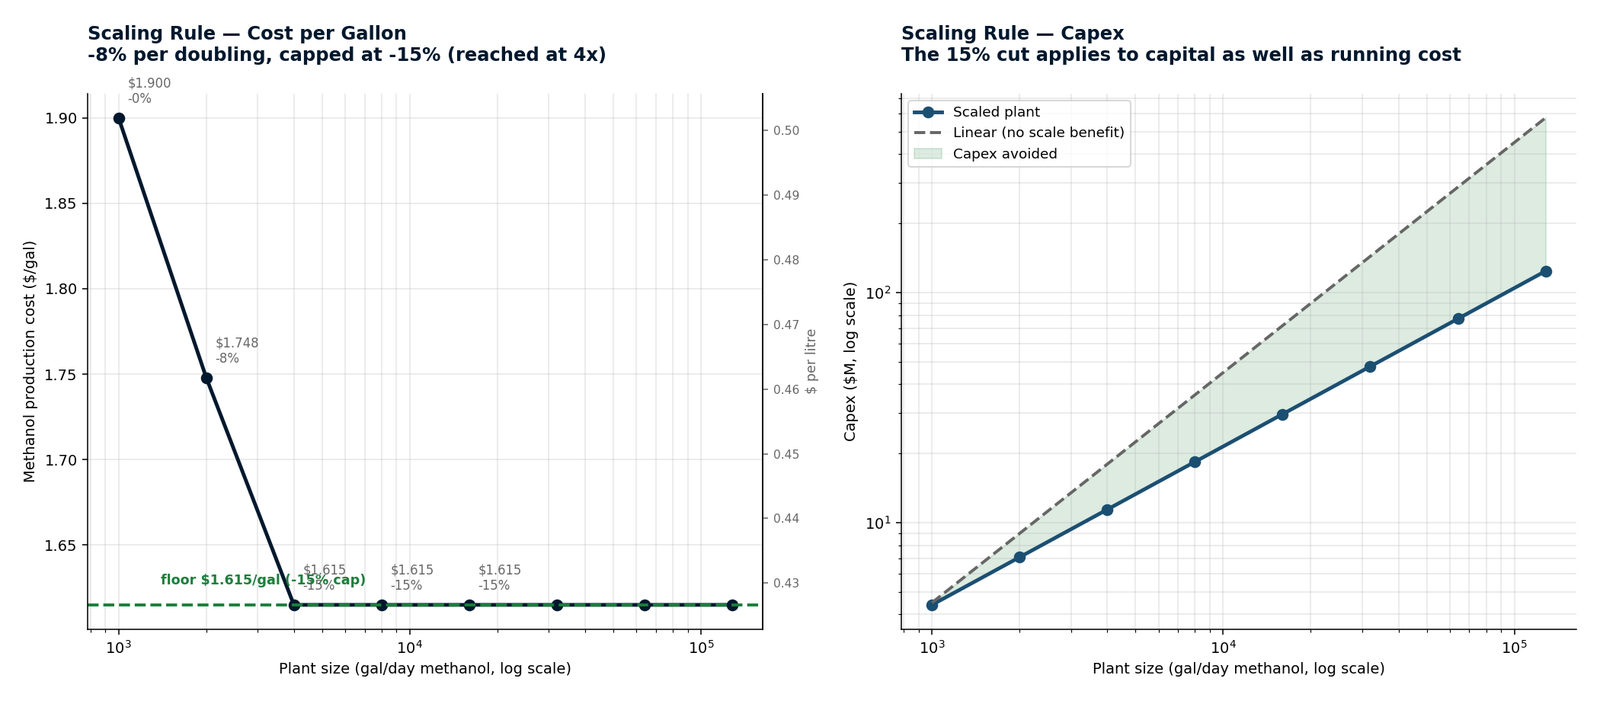
The scaling rule cuts Iceland's aviation capex from $64.9M to $55.2M.
What a location spends now. The amber block is distribution and marketing — the layer FFA removes by producing on site.
Total spend on road and aviation fuel, and how much of it is distribution rather than product.
Honest caveat: $0.2–3.6M a year against $3–30M of capex. It supports the siting decision; it does not justify the investment.
The database carries retail tariffs. On a real PPA, viability goes from 11 to 63 of 68 countries for diesel.
12 charts in this group. All figures in both litres and US gallons.
Meet the team, with dedicated sections for Dr Steve Clamp and Professor Tony Marmont.
Contact the team →
Team section
Steve has devoted more than 30 years to aerospace development, with particular expertise in aerospace vehicle design and structural analysis across both military and civil aerospace engineering programs.
Throughout his career, Steve has worked with some of the world’s leading aerospace organizations, including Boeing, Airbus, British Aerospace and Rolls-Royce Aero Engines. More recently, he has been involved in the new space race, contributing to major launch vehicle programs including SLS and New Glenn.
Steve first joined forces with Professor Tony Marmont in 1992, when he became Chief Engineer at Fuel From Air Turbines. He was rapidly promoted to Managing Director, and his close collaboration with Tony has continued ever since.
As the North American partner for Fuel From Air, Steve has presented the FFA business model to several major corporations, helping to build international awareness of the technology and its commercial potential.
Steve’s main motivation is to introduce and develop Fuel From Air technology in regions that are currently heavily dependent on, and constrained by, the dominant fossil-fuel industry. His focus is on practical deployment, engineering credibility and creating an alternative pathway for communities and industries that need cleaner, more secure access to liquid fuels.
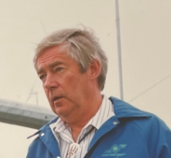
Memorable Person · Wind Energy Pioneer
DSc · DTech · Energy Medal for Lifetime Achievement
Few people did more to bring small and medium wind generation into the UK than Professor Tony Marmont. After making his fortune in soft drinks and plastics, he turned his energy toward renewable generation following the 1970s oil crisis — and quickly recognised that practical, distributed wind power was central to any credible energy transition.
In the early 1990s Tony acquired the rights to the American Fuel From Air Turbines technology and backed the establishment of Fuel From Air Turbines UK — making it one of the few British-owned companies producing 300 kW class machines. The Carter machines were unusual for their time: two-bladed, soft-tower, downwind designs that prioritised energy capture over conformity to the dominant three-blade European norm. Great Orton wind farm in Cumbria — Britain's only farm of Carter turbines — became the operational legacy of that effort.
Tony then founded Beacon Energy in 1992 as a not-for-profit organisation and turned West Beacon Farm near Loughborough into one of the world's most complete working demonstrations of an integrated renewable energy network — combining wind turbines, photovoltaics, ground-source heat pumps, hydrogen storage with electrolysers and fuel cells, hydro generation and CHP, all feeding a common DC bus.
He endowed renewable energy research centres at three universities, including CREST at Loughborough, AMSET at De Montfort, and the renewable energy programme at the University of Nottingham.
Steve Clamp is honoured to have known Tony as a mentor, collaborator, and friend. His pragmatic, evidence-led approach to wind turbine engineering — and his refusal to be deterred by conventional wisdom — remain a constant influence on the Fuel From Air programme.
Text adapted from the uploaded SteveClamp Memorable People section.
Engineering detail on the conversion plant, its cost structure, and the pilot programmes that prove the process.
Four project workstreams. Each is restricted — select one and log in with the site passcode to open it.